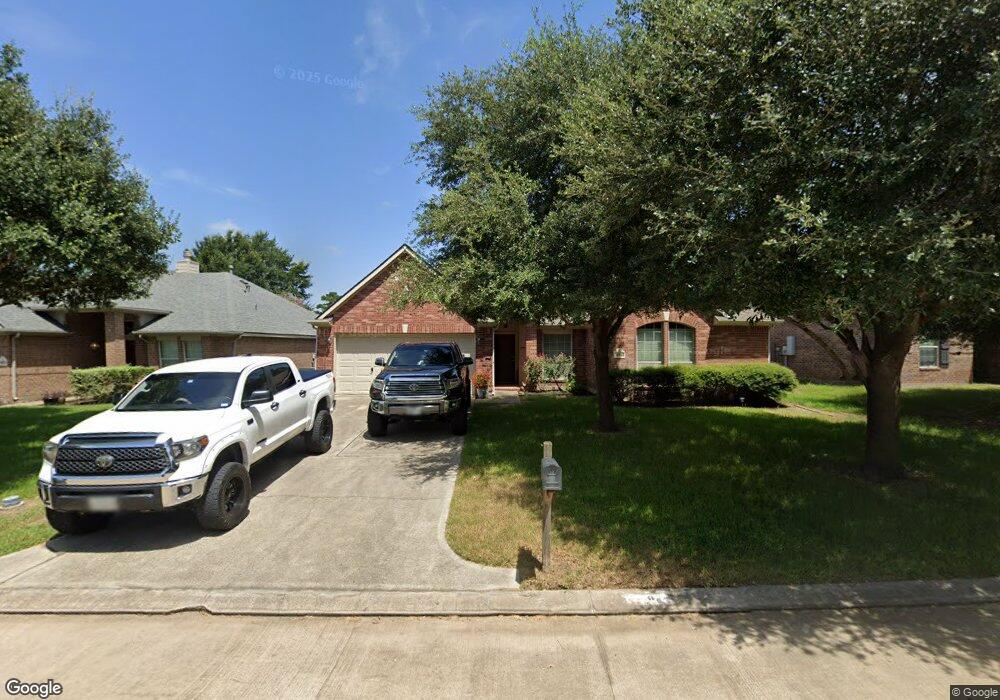
30807 Roadie Pass Magnolia, TX 77355
Estimated Value: $285,000 - $347,000
4
Beds
2
Baths
2,299
Sq Ft
$136/Sq Ft
Est. Value
About This Home
This home is located at 30807 Roadie Pass, Magnolia, TX 77355 and is currently estimated at $313,441, approximately $136 per square foot. 30807 Roadie Pass is a home located in Montgomery County with nearby schools including Magnolia Elementary School, Magnolia Sixth Grade Campus, and Magnolia Junior High School.
Ownership History
Date
Name
Owned For
Owner Type
Purchase Details
Closed on
Apr 27, 2012
Sold by
Khbm Partners Ii Ltd
Bought by
Clepper Julian Marcus
Current Estimated Value
Home Financials for this Owner
Home Financials are based on the most recent Mortgage that was taken out on this home.
Original Mortgage
$140,000
Outstanding Balance
$97,317
Interest Rate
3.97%
Mortgage Type
New Conventional
Estimated Equity
$216,124
Purchase Details
Closed on
Nov 11, 2010
Sold by
Dci Of Magnolia Inc
Bought by
Khbm Partners Ii Ltd
Home Financials for this Owner
Home Financials are based on the most recent Mortgage that was taken out on this home.
Original Mortgage
$136,792
Interest Rate
4.27%
Mortgage Type
Purchase Money Mortgage
Create a Home Valuation Report for This Property
The Home Valuation Report is an in-depth analysis detailing your home's value as well as a comparison with similar homes in the area
Home Values in the Area
Average Home Value in this Area
Purchase History
| Date | Buyer | Sale Price | Title Company |
|---|---|---|---|
| Clepper Julian Marcus | -- | Startex Title | |
| Khbm Partners Ii Ltd | -- | Startex 07 Title Company |
Source: Public Records
Mortgage History
| Date | Status | Borrower | Loan Amount |
|---|---|---|---|
| Open | Clepper Julian Marcus | $140,000 | |
| Previous Owner | Khbm Partners Ii Ltd | $136,792 |
Source: Public Records
Tax History Compared to Growth
Tax History
| Year | Tax Paid | Tax Assessment Tax Assessment Total Assessment is a certain percentage of the fair market value that is determined by local assessors to be the total taxable value of land and additions on the property. | Land | Improvement |
|---|---|---|---|---|
| 2025 | $3,496 | $311,758 | $33,592 | $278,166 |
| 2024 | $3,080 | $299,277 | -- | -- |
| 2023 | $3,080 | $272,070 | $33,590 | $249,580 |
| 2022 | $4,365 | $247,340 | $33,590 | $259,010 |
| 2021 | $4,179 | $224,850 | $33,590 | $191,260 |
| 2020 | $4,247 | $209,840 | $33,590 | $176,250 |
| 2019 | $4,224 | $209,720 | $33,590 | $176,130 |
| 2018 | $3,753 | $204,300 | $24,500 | $179,800 |
| 2017 | $4,332 | $204,300 | $24,500 | $179,800 |
| 2016 | $4,201 | $198,100 | $24,500 | $173,600 |
| 2015 | $3,586 | $181,040 | $24,500 | $156,540 |
| 2014 | $3,586 | $177,180 | $24,500 | $159,740 |
Source: Public Records
Map
Nearby Homes
- 31011 E Lost Creek Blvd
- 38214 E Sulphur Creek Dr
- 31015 E Lost Creek Blvd
- 30607 N Sulphur Creek Dr
- 30515 Red Bluff Cir
- 38910 Fm 1774 Rd
- 30731 N Cripple Creek Dr
- 28812 Village Bend
- 100 Sterling River Ln
- 30814 N Cripple Creek Dr
- TBD N Cripple Creek Dr
- 28822 Village Bend
- 163 Sterling River Ln
- 30714 Meadow Wood Lot 64 Dr
- 177 Sterling River Ln
- 186 Sterling River Ln
- 190 Sterling River Ln
- 194 Sterling River Ln
- Springsteen Plan at Magnolia Ridge - Watermill Collection
- Joplin Plan at Magnolia Ridge - Watermill Collection
- 30803 Roadie Pass
- 30811 Roadie Pass
- 30719 Roadie Pass
- 30815 Roadie Pass
- 38442 E Sulphur Creek Dr
- 38438 E Sulphur Creek Dr
- 38446 E Sulphur Creek Dr
- 30819 Roadie Pass
- 30715 Roadie Pass
- 30814 Roadie Pass
- 38434 E Sulphur Creek Dr
- 30806 Roadie Pass
- 30810 Roadie Pass
- 30818 Roadie Pass
- 30802 Roadie Pass
- 30903 Roadie Pass
- 30711 Roadie Pass
- 30722 Roadie Pass
- 38430 E Sulphur Creek Dr
- 30718 Roadie Pass