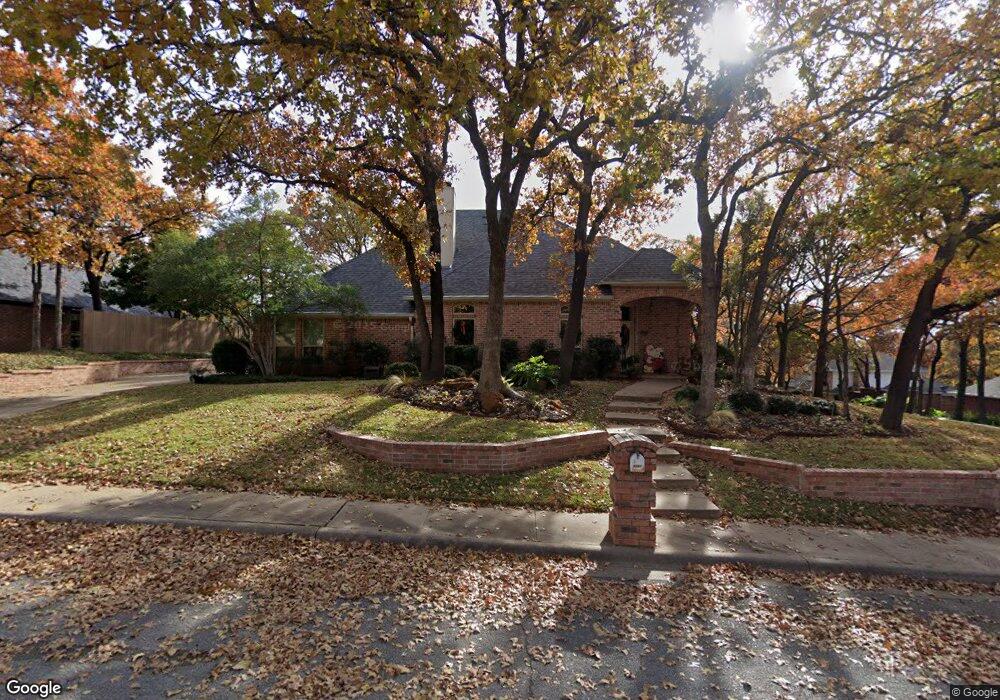
3081 High Cliff Dr Grapevine, TX 76051
Estimated Value: $605,832 - $638,000
3
Beds
2
Baths
2,334
Sq Ft
$269/Sq Ft
Est. Value
About This Home
This home is located at 3081 High Cliff Dr, Grapevine, TX 76051 and is currently estimated at $628,208, approximately $269 per square foot. 3081 High Cliff Dr is a home located in Tarrant County with nearby schools including O.C. Taylor Elementary School, Cross Timbers Middle School, and Grapevine High School.
Ownership History
Date
Name
Owned For
Owner Type
Purchase Details
Closed on
Nov 30, 2017
Sold by
Arnold Linda D
Bought by
Acker Linda A and Arnold Living Trust
Current Estimated Value
Purchase Details
Closed on
Jul 25, 2007
Sold by
Johnson Jenny D and Johnson Gregory
Bought by
Parks Kathy K
Home Financials for this Owner
Home Financials are based on the most recent Mortgage that was taken out on this home.
Original Mortgage
$50,000
Outstanding Balance
$31,593
Interest Rate
6.71%
Mortgage Type
Purchase Money Mortgage
Estimated Equity
$596,615
Purchase Details
Closed on
Nov 30, 2000
Sold by
Erdmanczyk Junelle
Bought by
Gibson Jenny D
Home Financials for this Owner
Home Financials are based on the most recent Mortgage that was taken out on this home.
Original Mortgage
$156,000
Interest Rate
7.72%
Purchase Details
Closed on
Jul 14, 2000
Sold by
Tepe William A
Bought by
Erdmanczyk Junelle
Purchase Details
Closed on
Apr 12, 2000
Sold by
Burrell Gale G and Burrell Donald W
Bought by
Tepe William A
Create a Home Valuation Report for This Property
The Home Valuation Report is an in-depth analysis detailing your home's value as well as a comparison with similar homes in the area
Home Values in the Area
Average Home Value in this Area
Purchase History
| Date | Buyer | Sale Price | Title Company |
|---|---|---|---|
| Acker Linda A | -- | None Available | |
| Parks Kathy K | -- | Commonwealth Land | |
| Gibson Jenny D | -- | Alamo Title Company | |
| Erdmanczyk Junelle | -- | -- | |
| Tepe William A | -- | Southwest Land Title |
Source: Public Records
Mortgage History
| Date | Status | Borrower | Loan Amount |
|---|---|---|---|
| Open | Parks Kathy K | $50,000 | |
| Previous Owner | Gibson Jenny D | $156,000 |
Source: Public Records
Tax History Compared to Growth
Tax History
| Year | Tax Paid | Tax Assessment Tax Assessment Total Assessment is a certain percentage of the fair market value that is determined by local assessors to be the total taxable value of land and additions on the property. | Land | Improvement |
|---|---|---|---|---|
| 2025 | $1,799 | $500,000 | $131,950 | $368,050 |
| 2024 | $1,799 | $527,806 | $131,950 | $395,856 |
| 2023 | $7,998 | $507,890 | $131,950 | $375,940 |
| 2022 | $8,593 | $433,865 | $131,950 | $301,915 |
| 2021 | $8,583 | $394,741 | $79,170 | $315,571 |
| 2020 | $9,243 | $420,238 | $79,170 | $341,068 |
| 2019 | $9,184 | $410,123 | $75,000 | $335,123 |
| 2018 | $1,879 | $366,131 | $75,000 | $291,131 |
| 2017 | $7,697 | $336,600 | $75,000 | $261,600 |
| 2016 | $6,998 | $302,587 | $75,000 | $227,587 |
| 2015 | $6,186 | $292,131 | $50,000 | $242,131 |
| 2014 | $6,186 | $286,600 | $50,000 | $236,600 |
Source: Public Records
Map
Nearby Homes
- 3828 Kelsey Ct
- 3223 Wintergreen Terrace
- 3530 Quail Crest St
- 3206 Wintergreen Terrace
- 4157 Heartstone Dr
- 3107 Wintergreen Terrace
- 2704 Yorkshire Ct
- 3329 Moss Creek Dr
- 3826 Shady Meadow Dr
- 2849 Timber Hill Dr
- 2805 Pine View Dr
- 3278 Birch Ave
- 4105 Williams Ct
- 2618 Pointe Ct
- 3321 Circlewood Ct
- 2602 Pointe Ct
- 4213 Hearthside Dr
- 4214 Hearthside Dr
- 3801 Hillside Trail
- 2906 Cottonwood Ln
- 3077 High Cliff Dr
- 3080 Hightimber Ct
- 3076 Hightimber Ct
- 3541 High Countryside Dr
- 3080 High Cliff Dr
- 3537 High Countryside Dr
- 3076 High Cliff Dr
- 3073 High Cliff Dr
- 3545 High Countryside Dr
- 3533 High Countryside Dr
- 3072 Hightimber Ct
- 3072 High Cliff Dr
- 3538 Hightimber Dr
- 3542 Hightimber Dr
- 3077 High Mesa Ct
- 3081 High Mesa Ct
- 3081 Hightimber Ct
- 3534 Hightimber Dr
- 3546 Hightimber Dr
- 3529 High Countryside Dr