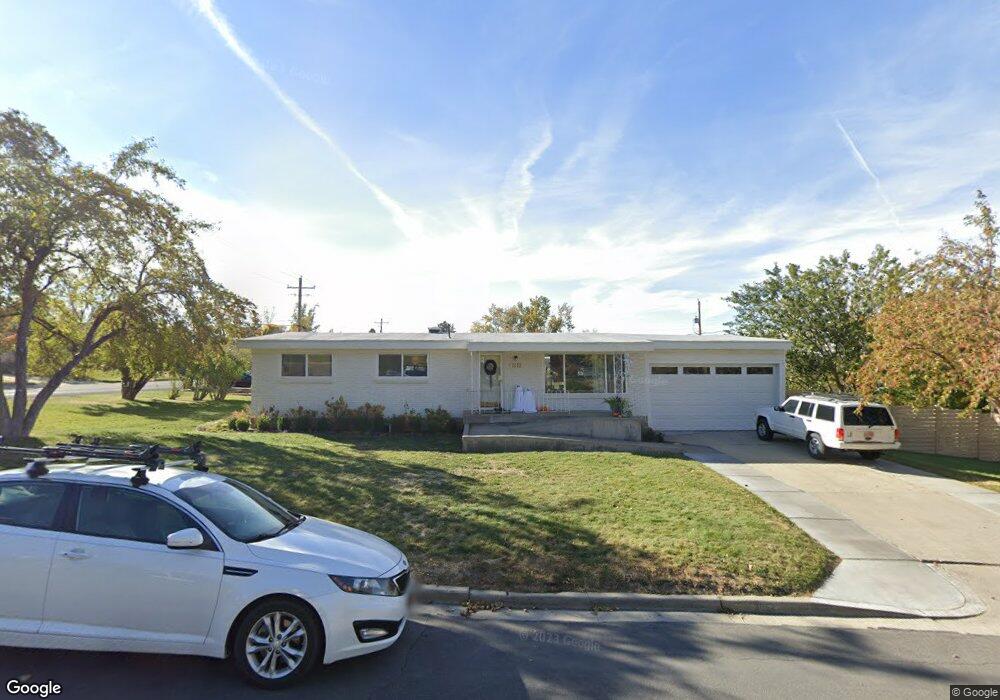
3082 S 200 E Bountiful, UT 84010
Estimated Value: $472,000 - $549,344
3
Beds
1
Bath
2,484
Sq Ft
$205/Sq Ft
Est. Value
About This Home
This home is located at 3082 S 200 E, Bountiful, UT 84010 and is currently estimated at $508,086, approximately $204 per square foot. 3082 S 200 E is a home located in Davis County with nearby schools including Boulton School, South Davis Junior High School, and Woods Cross High School.
Ownership History
Date
Name
Owned For
Owner Type
Purchase Details
Closed on
Jul 16, 2020
Sold by
Frost Scott M and Frost Scott
Bought by
Frost Scott M and Frost Katie
Current Estimated Value
Home Financials for this Owner
Home Financials are based on the most recent Mortgage that was taken out on this home.
Original Mortgage
$253,602
Outstanding Balance
$223,948
Interest Rate
3%
Mortgage Type
New Conventional
Estimated Equity
$284,138
Purchase Details
Closed on
Dec 20, 2019
Sold by
Sorenson Cindy J and The Ure Investment Trust
Bought by
Frost Scott
Home Financials for this Owner
Home Financials are based on the most recent Mortgage that was taken out on this home.
Original Mortgage
$221,600
Interest Rate
3.6%
Mortgage Type
New Conventional
Purchase Details
Closed on
Oct 12, 2018
Sold by
Ure Willis L and Sorenson Cindy
Bought by
Sorenson Cindy J and The Ure Investment Trust
Purchase Details
Closed on
Sep 14, 2010
Sold by
Ure Willis L
Bought by
Ure Willis L and Sorenson Cindy
Purchase Details
Closed on
Oct 21, 1998
Sold by
Ure Willis L
Bought by
Ure Willis L
Create a Home Valuation Report for This Property
The Home Valuation Report is an in-depth analysis detailing your home's value as well as a comparison with similar homes in the area
Purchase History
| Date | Buyer | Sale Price | Title Company |
|---|---|---|---|
| Frost Scott M | -- | Vantage Point Title | |
| Frost Scott | -- | Titan Title Insuran | |
| Sorenson Cindy J | -- | None Available | |
| Ure Willis L | -- | None Available | |
| Ure Willis L | -- | -- |
Source: Public Records
Mortgage History
| Date | Status | Borrower | Loan Amount |
|---|---|---|---|
| Open | Frost Scott M | $253,602 | |
| Closed | Frost Scott | $221,600 |
Source: Public Records
Tax History
| Year | Tax Paid | Tax Assessment Tax Assessment Total Assessment is a certain percentage of the fair market value that is determined by local assessors to be the total taxable value of land and additions on the property. | Land | Improvement |
|---|---|---|---|---|
| 2025 | $2,876 | $260,150 | $144,456 | $115,694 |
| 2024 | $2,970 | $275,000 | $132,905 | $142,095 |
| 2023 | $3,030 | $508,000 | $244,715 | $263,285 |
| 2022 | $3,097 | $290,950 | $130,833 | $160,117 |
| 2021 | $2,860 | $412,000 | $194,778 | $217,222 |
| 2020 | $2,077 | $296,000 | $142,869 | $153,131 |
| 2019 | $2,043 | $288,000 | $138,067 | $149,933 |
| 2018 | $1,904 | $264,000 | $133,475 | $130,525 |
| 2016 | $1,510 | $120,670 | $48,854 | $71,816 |
| 2015 | $1,457 | $110,110 | $48,854 | $61,256 |
| 2014 | $1,471 | $113,759 | $48,854 | $64,905 |
| 2013 | -- | $113,122 | $41,106 | $72,016 |
Source: Public Records
Map
Nearby Homes
- 438 Indian Springs Rd
- 424 E Canyon Estates Dr S
- 11 E Bonneville Dr
- 3551 S Huntington Dr
- 8 E 3500 S
- 3716 S Oakridge Cir
- 69 E North Canyon Rd
- 610 Meadowlark Ln
- 19 E North Canyon Rd
- 2292 S 250 E
- 337 W 2900 S
- 2273 S 200 E
- 110 2250 S
- 993 Canyon Creek Dr
- 336 W 3500 S
- 320 E 2100 S
- 404 W 2700 S
- 41 E 2200 S
- 761 San Simeon Way
- 468 W 3200 S
Your Personal Tour Guide
Ask me questions while you tour the home.