Estimated Value: $442,000 - $467,000
4
Beds
3
Baths
2,384
Sq Ft
$190/Sq Ft
Est. Value
About This Home
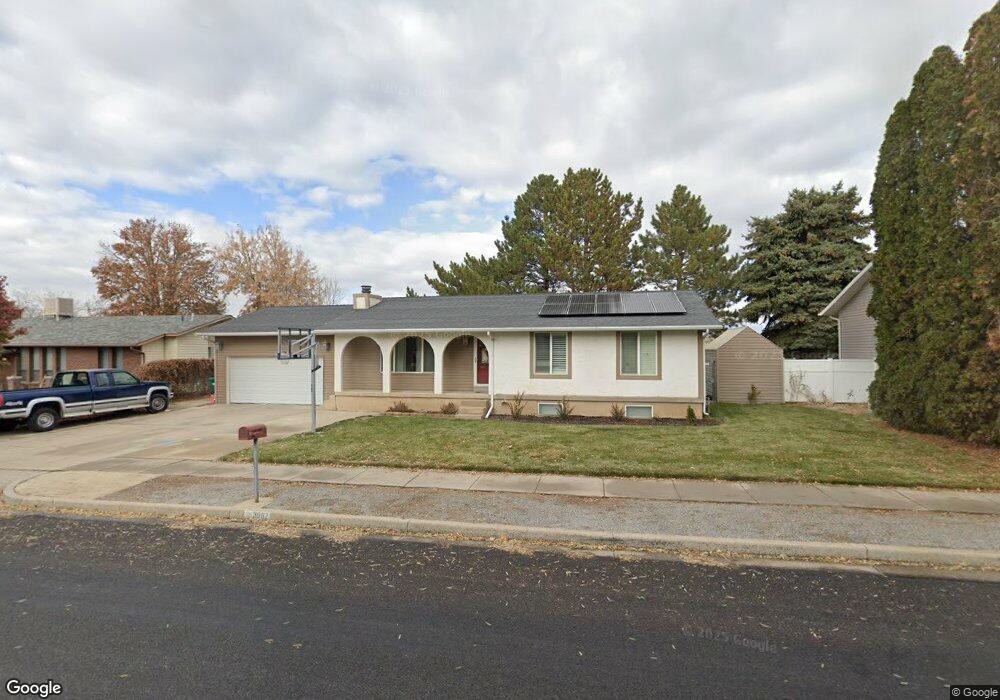
This home is located at 3082 W 5500 S, Roy, UT 84067 and is currently estimated at $453,149, approximately $190 per square foot. 3082 W 5500 S is a home located in Weber County with nearby schools including Roy Elementary School, Roy Junior High School, and Roy High School.
Ownership History
Date
Name
Owned For
Owner Type
Purchase Details
Closed on
Apr 11, 2023
Sold by
State Of Utah
Bought by
Hufford Jordan and Burningham Connor
Current Estimated Value
Home Financials for this Owner
Home Financials are based on the most recent Mortgage that was taken out on this home.
Original Mortgage
$449,480
Outstanding Balance
$436,758
Interest Rate
6.5%
Mortgage Type
FHA
Estimated Equity
$16,391
Purchase Details
Closed on
May 14, 2021
Sold by
Halstead Joshua and Wright Whitney
Bought by
Halstead Joshua and Halstead Whitney
Home Financials for this Owner
Home Financials are based on the most recent Mortgage that was taken out on this home.
Original Mortgage
$324,800
Interest Rate
3.1%
Mortgage Type
New Conventional
Purchase Details
Closed on
Nov 9, 2020
Sold by
South Sharon and South John
Bought by
Haistead Joshua and Haistead Whitney
Home Financials for this Owner
Home Financials are based on the most recent Mortgage that was taken out on this home.
Original Mortgage
$318,645
Interest Rate
2.8%
Mortgage Type
New Conventional
Purchase Details
Closed on
Mar 18, 2019
Sold by
Cordingly Kiersten
Bought by
South Sharon and South John
Home Financials for this Owner
Home Financials are based on the most recent Mortgage that was taken out on this home.
Original Mortgage
$275,910
Interest Rate
5.62%
Mortgage Type
FHA
Purchase Details
Closed on
Sep 15, 2016
Sold by
Mindrum Brice C and Mindrum Tammy
Bought by
Cordingly Kiersten
Home Financials for this Owner
Home Financials are based on the most recent Mortgage that was taken out on this home.
Original Mortgage
$13,660
Interest Rate
3.43%
Mortgage Type
Stand Alone Second
Purchase Details
Closed on
Nov 9, 2001
Sold by
Mindrum Brice C and Draper Tammy
Bought by
Mindrum Brice C and Mindrum Tammy
Home Financials for this Owner
Home Financials are based on the most recent Mortgage that was taken out on this home.
Original Mortgage
$105,000
Interest Rate
6.09%
Purchase Details
Closed on
Aug 11, 1999
Sold by
White Robert S and White Phyllis C
Bought by
Mindrum Brice C and Drapper Tammy
Home Financials for this Owner
Home Financials are based on the most recent Mortgage that was taken out on this home.
Original Mortgage
$105,900
Interest Rate
7.7%
Create a Home Valuation Report for This Property
The Home Valuation Report is an in-depth analysis detailing your home's value as well as a comparison with similar homes in the area
Home Values in the Area
Average Home Value in this Area
Purchase History
| Date | Buyer | Sale Price | Title Company |
|---|---|---|---|
| Hufford Jordan | -- | None Listed On Document | |
| Halstead Joshua | -- | Hickman Land Title Layton | |
| Haistead Joshua | -- | Us Title Insurance Agency | |
| South Sharon | -- | Stewart Title Ins Agcy Of | |
| Cordingly Kiersten | -- | Eagle Gate Title Ins Agency | |
| Mindrum Brice C | -- | Bonneville Title | |
| Mindrum Brice C | -- | Bonneville Title Company |
Source: Public Records
Mortgage History
| Date | Status | Borrower | Loan Amount |
|---|---|---|---|
| Open | Hufford Jordan | $449,480 | |
| Previous Owner | Halstead Joshua | $324,800 | |
| Previous Owner | Haistead Joshua | $318,645 | |
| Previous Owner | South Sharon | $275,910 | |
| Previous Owner | Cordingly Kiersten | $13,660 | |
| Previous Owner | Cordingly Kiersten | $233,197 | |
| Previous Owner | Mindrum Brice C | $105,000 | |
| Previous Owner | Mindrum Brice C | $105,900 |
Source: Public Records
Tax History Compared to Growth
Tax History
| Year | Tax Paid | Tax Assessment Tax Assessment Total Assessment is a certain percentage of the fair market value that is determined by local assessors to be the total taxable value of land and additions on the property. | Land | Improvement |
|---|---|---|---|---|
| 2025 | $2,723 | $433,604 | $121,827 | $311,777 |
| 2024 | $2,656 | $234,299 | $67,004 | $167,295 |
| 2023 | $2,532 | $223,300 | $66,315 | $156,985 |
| 2022 | $2,716 | $248,051 | $58,361 | $189,690 |
| 2021 | $2,155 | $322,000 | $75,808 | $246,192 |
| 2020 | $2,073 | $285,000 | $75,808 | $209,192 |
| 2019 | $1,988 | $257,000 | $45,624 | $211,376 |
| 2018 | $2,003 | $245,000 | $43,676 | $201,324 |
| 2017 | $1,784 | $203,000 | $43,676 | $159,324 |
| 2016 | $1,599 | $96,886 | $21,285 | $75,601 |
| 2015 | $1,384 | $84,832 | $21,285 | $63,547 |
| 2014 | $1,339 | $80,834 | $21,285 | $59,549 |
Source: Public Records
Map
Nearby Homes
- 5538 S 3150 W
- 5432 S 3150 W
- 3166 W 5625 S
- 3176 W 5625 S
- 5321 S 3100 W
- 3186 W 5625 S
- 2786 W 5550 S Unit C11
- 2778 W 5550 S Unit 28
- 2907 W 5775 S
- 3198 W 5825 S
- 5317 S 2690 W
- 5791 S 3260 W
- 2646 W 5625 S Unit M-2646
- 2672 W 5750 S
- 5063 S 2825 W
- 5009 S 2925 W
- 3443 W 5200 S Unit 2&3
- 2829 W 5925 S
- 5998 S 3100 W
- 5056 S 2800 W