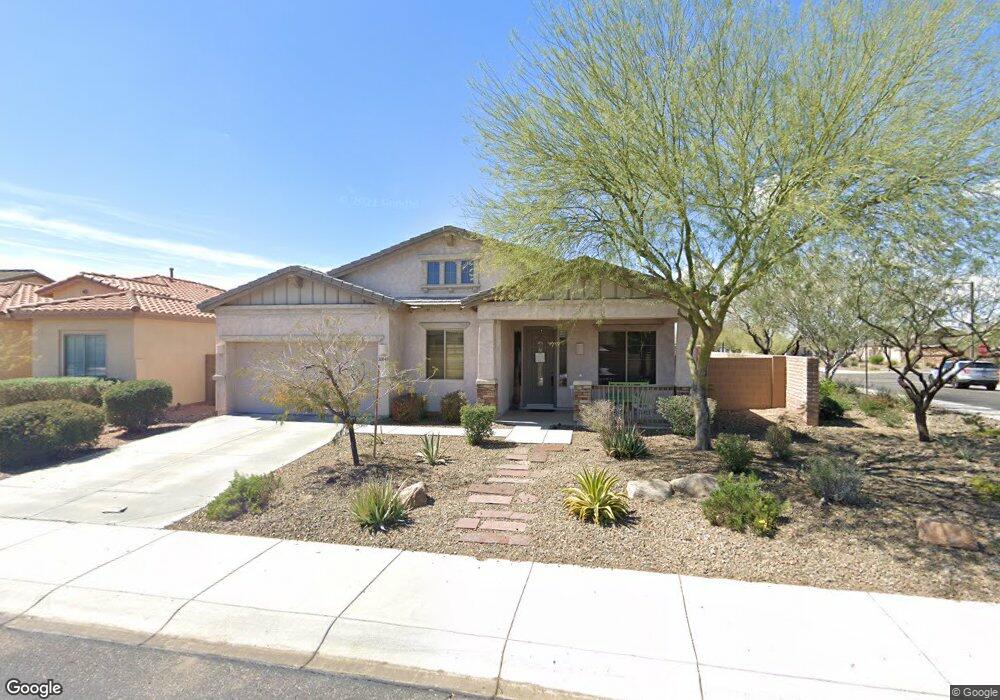
30848 N 126th Dr Peoria, AZ 85383
Estimated Value: $496,703 - $583,000
3
Beds
2
Baths
2,309
Sq Ft
$227/Sq Ft
Est. Value
About This Home
This home is located at 30848 N 126th Dr, Peoria, AZ 85383 and is currently estimated at $523,926, approximately $226 per square foot. 30848 N 126th Dr is a home located in Maricopa County with nearby schools including Vistancia Elementary School and Liberty High School.
Ownership History
Date
Name
Owned For
Owner Type
Purchase Details
Closed on
Jan 11, 2010
Sold by
Deutsche Bank National Trust Company
Bought by
Mcmahan Christopher Brandon and Mcmahan Raeanna
Current Estimated Value
Home Financials for this Owner
Home Financials are based on the most recent Mortgage that was taken out on this home.
Original Mortgage
$161,912
Outstanding Balance
$105,220
Interest Rate
4.75%
Mortgage Type
FHA
Estimated Equity
$418,706
Purchase Details
Closed on
Nov 3, 2009
Sold by
Mcghee Christopher and Mcghee Kimberly
Bought by
Deutsche Bank National Trust Company
Purchase Details
Closed on
Aug 8, 2006
Sold by
Tousa Homes Inc
Bought by
Mcghee Chritopher and Mcghee Kimberly
Home Financials for this Owner
Home Financials are based on the most recent Mortgage that was taken out on this home.
Original Mortgage
$384,750
Interest Rate
6.76%
Mortgage Type
New Conventional
Purchase Details
Closed on
Mar 8, 2006
Sold by
Gmac Model Home Finance Inc
Bought by
Tousa Homes Inc
Create a Home Valuation Report for This Property
The Home Valuation Report is an in-depth analysis detailing your home's value as well as a comparison with similar homes in the area
Home Values in the Area
Average Home Value in this Area
Purchase History
| Date | Buyer | Sale Price | Title Company |
|---|---|---|---|
| Mcmahan Christopher Brandon | $164,900 | Lsi Title Agency | |
| Deutsche Bank National Trust Company | $369,308 | Accommodation | |
| Mcghee Chritopher | $405,000 | Universal Land Title Agency | |
| Tousa Homes Inc | $3,380,551 | First American Title |
Source: Public Records
Mortgage History
| Date | Status | Borrower | Loan Amount |
|---|---|---|---|
| Open | Mcmahan Christopher Brandon | $161,912 | |
| Previous Owner | Mcghee Chritopher | $384,750 |
Source: Public Records
Tax History Compared to Growth
Tax History
| Year | Tax Paid | Tax Assessment Tax Assessment Total Assessment is a certain percentage of the fair market value that is determined by local assessors to be the total taxable value of land and additions on the property. | Land | Improvement |
|---|---|---|---|---|
| 2025 | $2,481 | $26,622 | -- | -- |
| 2024 | $2,513 | $25,354 | -- | -- |
| 2023 | $2,513 | $37,420 | $7,480 | $29,940 |
| 2022 | $2,497 | $29,910 | $5,980 | $23,930 |
| 2021 | $2,614 | $27,820 | $5,560 | $22,260 |
| 2020 | $2,613 | $25,820 | $5,160 | $20,660 |
| 2019 | $2,523 | $24,420 | $4,880 | $19,540 |
| 2018 | $2,428 | $22,830 | $4,560 | $18,270 |
| 2017 | $2,410 | $22,160 | $4,430 | $17,730 |
| 2016 | $1,997 | $22,230 | $4,440 | $17,790 |
| 2015 | $2,220 | $20,720 | $4,140 | $16,580 |
Source: Public Records
Map
Nearby Homes
- 12679 W Lowden Rd
- 30680 N 126th Dr
- 12775 W Lowden Rd
- 12788 W Chucks Ave
- 12519 W Palo Brea Ln
- 30876 N 128th Dr
- 12858 W Pasaro Dr
- 12481 W Milton Dr
- 30277 N 125th Ln
- 12845 W Milton Dr
- 12512 W Desert Mirage Dr
- 12838 W Desert Mirage Dr
- 12487 W Oyer Ln
- 12515 W Red Hawk Dr
- 26379 N 77th Glen
- 12904 W Chucks Ave
- 12940 W Creosote Dr
- 12335 W Milton Dr
- 30246 N 123rd Ln
- 31210 N 122nd Ln
- 30834 N 126th Dr
- 30820 N 126th Dr
- 12628 W Lowden Rd
- 30858 N 126th Dr
- 30806 N 126th Dr
- 12626 W Lowden Rd
- 30857 N 126th Dr
- 30792 N 126th Dr
- 12687 W Lowden Rd
- 12629 W Lowden Rd
- 30865 N 126th Dr
- 30866 N 126th Dr
- 30873 N 126th Dr
- 12624 W Lowden Rd
- 30898 N 126th Dr
- 30881 N 126th Dr
- 12616 W Lowden Rd
- 30855 N 127th Ave
- 12627 W Lowden Rd
- 30874 N 126th Dr