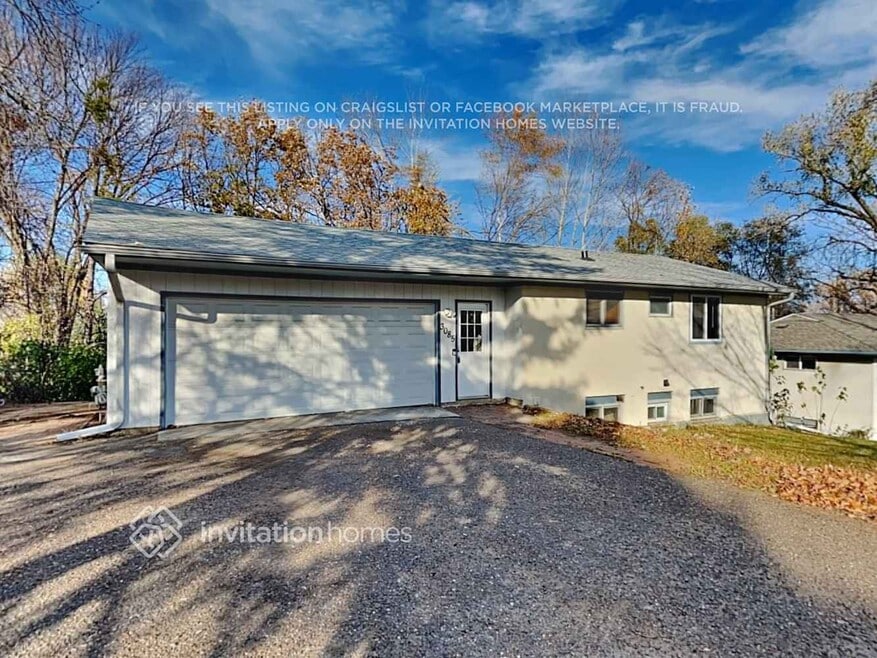
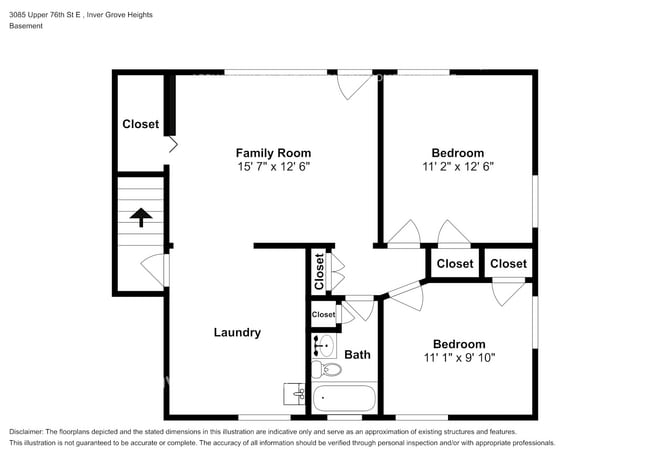
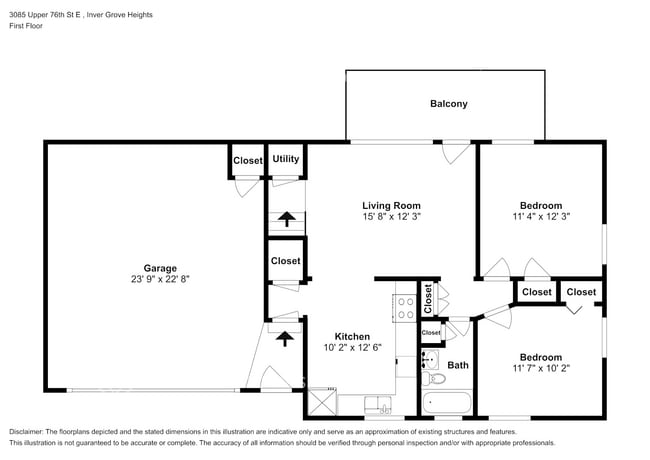
3085 Upper 76th St E Inver Grove Heights, MN 55076
About This Home
Lease this home and get more from Invitation Homes professional property management. This home comes fully loaded with quality amenities, must-have services, high-end tech and ProCare® professional maintenance. Your estimated total monthly payment is $2159.95. That covers your base rent, $2110.00 + our required services designed to make your life easier: Smart Home with video doorbell $40 and Utility Billing Service Fee $9.95. Base rent varies based on selected lease term.
The advertised base rent above includes a $100 maintenance credit. Total Monthly Rent may increase based on optional services selected by the resident.
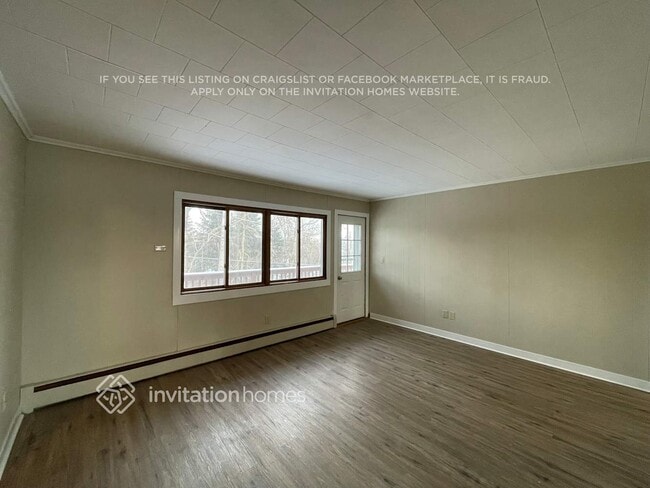
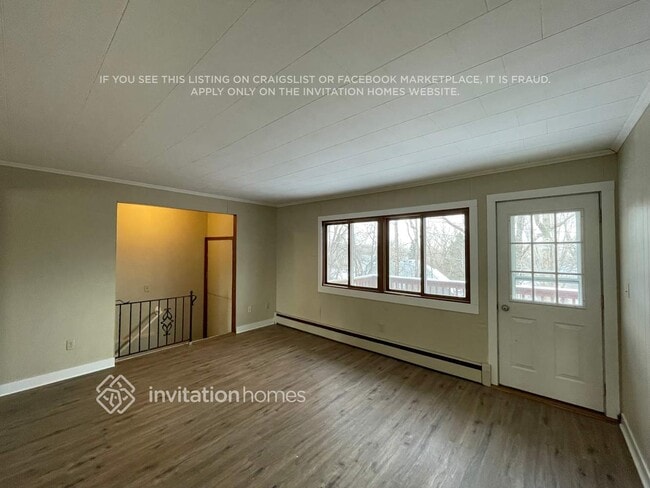
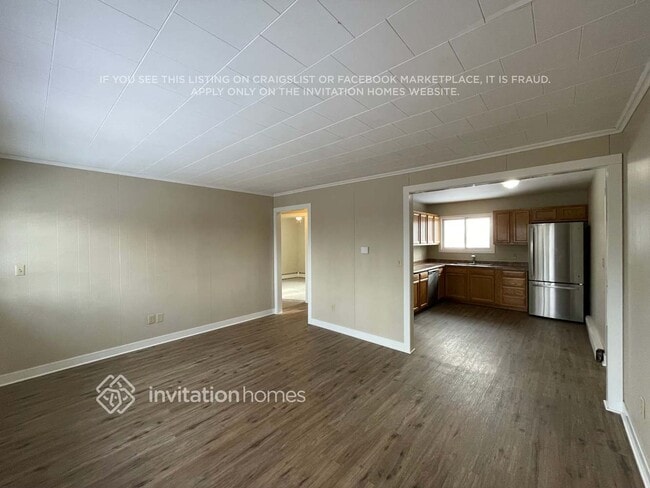
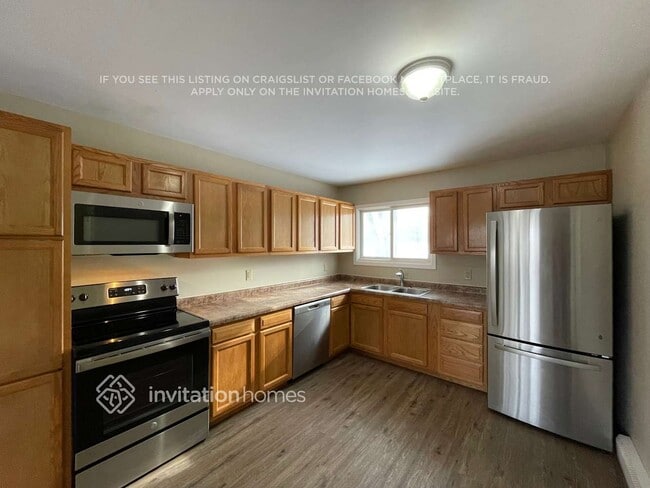
Who said the perfect house doesn't exist. It's right here! This layout makes it easy to entertain, cook, or relax when you need a break. The luxury vinyl plank flooring will surely catch your eye. Pull your friends into this breathtaking kitchen. They will surely compliment the sleek countertops, stainless steel appliances, and premium cabinets. Outside, the attractive backyard offers a space to stretch out, soak up sunlight, or watch the stars. Make this stellar home yours and apply online today!
At Invitation Homes, we offer pet-friendly, yard-having homes for lease with Smart Home technology in awesome neighborhoods across the country. Live in a great house without the headache and long-term commitment of owning. Discover your dream home with Invitation Homes.
Our Lease Easy bundle – which includes Smart Home, Air Filter Delivery, and Utilities Management – is a key part of your worry-free leasing lifestyle. These services are required by your lease at an additional monthly cost. Monthly fees for pets and pools may also apply.
Home Features and Amenities: Deck, Garage, Long Lease Terms, Luxury Vinyl Plank, Pet Friendly, Smart Home, Stainless Steel Appliances, W/D Hookups, and professionally managed by Invitation Homes.
This Invitation Home is currently being renovated, but it will be available soon. You can still apply – contact us for more details or apply now.
Invitation Homes is an equal housing lessor under the FHA. Applicable local, state and federal laws may apply. Additional terms and conditions apply. This listing is not an offer to rent. You must submit additional information including an application to rent and an application fee. All leasing information is believed to be accurate, but changes may have occurred since photographs were taken and square footage is estimated. See InvitationHomes website for more information.
Beware of scams: Employees of Invitation Homes will never ask you for your username and password. Invitation Homes does not advertise on Craigslist, Social Serve, etc. We own our homes; there are no private owners. All funds to lease with Invitation Homes are paid directly through our website, never through wire transfer or payment app like Zelle, Pay Pal, or Cash App.
For more info, please submit an inquiry for this home. Applications are subject to our qualification requirements. Additional terms and conditions apply. CONSENT TO CALLS & TEXT MESSAGING: By entering your contact information, you expressly consent to receive emails, calls, and text messages from Invitation Homes including by autodialer, prerecorded or artificial voice and including marketing communications. Msg & Data rates may apply. You also agree to our Terms of Use and our Privacy Policy.

Map
- 3080 Upper 76th St E
- 7459 Carmen Ave
- 3295 80th St E Unit 508
- 7944 Charles Way
- 7393 Clayton Ave
- 7980 Bowman Ave
- 7614 Connie Ln
- 7602 Connie Ln
- 2584 76th St E
- 7636 Borman Way
- 3617 76th Ln E
- 7169 Clay Ave
- 7134 Claude Ave
- 7317 Bond Way Unit 13
- 7311 Brittany Ln
- 8124 Clifford Cir
- 7892 Blackstone Ave
- 8361 Carew Ct
- 3861 Conroy Trail
- 3750 80th St E
- 8213 College Trail
- 8851-8891 Broderick Blvd
- 6043 Candace Ave
- 1462 80th St E
- 5721-5733 Brent Ave
- 5480 Blackberry Trail
- 1241 Mullan Ct
- 6997 Angela Trail
- 6848 Aqua Trail
- 6930 Angela Trail
- 1209 8th Ave S Unit 1211
- 6757 Allen Ct
- 251 Buron Ln
- 465 3rd Ave Unit Lower
- 221 Buron Ln
- 1860 52nd St E
- 680 6th St
- 5335-5365 Audobon Ave
- 1455 Upper 55th St E
- 1542 3rd Ave