Estimated Value: $951,788 - $1,061,000
4
Beds
3
Baths
3,276
Sq Ft
$310/Sq Ft
Est. Value
About This Home
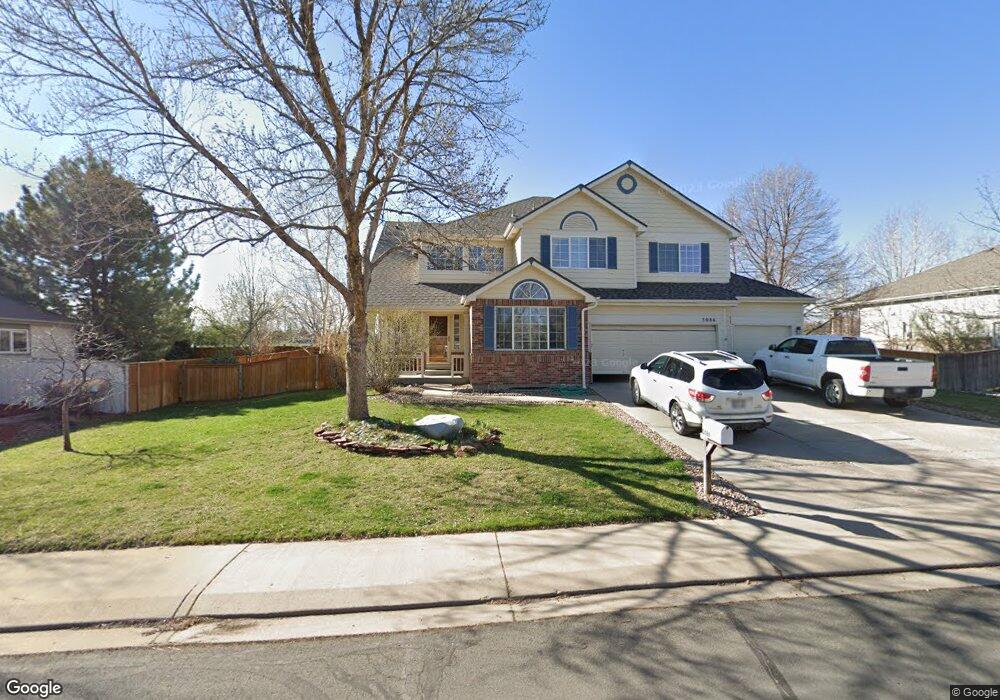
This home is located at 3086 Stevens Cir S, Erie, CO 80516 and is currently estimated at $1,015,197, approximately $309 per square foot. 3086 Stevens Cir S is a home located in Boulder County with nearby schools including Meadowlark School, Centaurus High School, and Peak to Peak Charter School.
Ownership History
Date
Name
Owned For
Owner Type
Purchase Details
Closed on
Aug 2, 2004
Sold by
Migroup Inc
Bought by
Beuning Stephen J
Current Estimated Value
Home Financials for this Owner
Home Financials are based on the most recent Mortgage that was taken out on this home.
Original Mortgage
$328,960
Outstanding Balance
$148,011
Interest Rate
4.62%
Mortgage Type
Purchase Money Mortgage
Estimated Equity
$867,186
Purchase Details
Closed on
Jun 8, 2004
Sold by
Cone Charles F and Cone Susan R
Bought by
The Migroup Inc
Home Financials for this Owner
Home Financials are based on the most recent Mortgage that was taken out on this home.
Original Mortgage
$328,960
Outstanding Balance
$148,011
Interest Rate
4.62%
Mortgage Type
Purchase Money Mortgage
Estimated Equity
$867,186
Purchase Details
Closed on
Mar 31, 2000
Sold by
1995 Corp Dba Remington Homes Inc
Bought by
Cone Charles F and Cone Susan R
Home Financials for this Owner
Home Financials are based on the most recent Mortgage that was taken out on this home.
Original Mortgage
$268,650
Interest Rate
7.5%
Create a Home Valuation Report for This Property
The Home Valuation Report is an in-depth analysis detailing your home's value as well as a comparison with similar homes in the area
Home Values in the Area
Average Home Value in this Area
Purchase History
| Date | Buyer | Sale Price | Title Company |
|---|---|---|---|
| Beuning Stephen J | $411,200 | -- | |
| The Migroup Inc | -- | -- | |
| Cone Charles F | $335,832 | -- |
Source: Public Records
Mortgage History
| Date | Status | Borrower | Loan Amount |
|---|---|---|---|
| Open | Beuning Stephen J | $328,960 | |
| Previous Owner | Cone Charles F | $268,650 | |
| Closed | Cone Charles F | $33,550 |
Source: Public Records
Tax History Compared to Growth
Tax History
| Year | Tax Paid | Tax Assessment Tax Assessment Total Assessment is a certain percentage of the fair market value that is determined by local assessors to be the total taxable value of land and additions on the property. | Land | Improvement |
|---|---|---|---|---|
| 2025 | $6,755 | $62,013 | $17,119 | $44,894 |
| 2024 | $6,755 | $62,013 | $17,119 | $44,894 |
| 2023 | $6,658 | $63,998 | $22,760 | $44,924 |
| 2022 | $5,542 | $49,908 | $15,366 | $34,542 |
| 2021 | $5,529 | $51,345 | $15,809 | $35,536 |
| 2020 | $4,903 | $45,117 | $10,725 | $34,392 |
| 2019 | $4,842 | $45,117 | $10,725 | $34,392 |
| 2018 | $4,832 | $44,201 | $13,752 | $30,449 |
| 2017 | $4,544 | $48,867 | $15,204 | $33,663 |
| 2016 | $4,463 | $42,045 | $15,283 | $26,762 |
| 2015 | $4,266 | $33,034 | $11,542 | $21,492 |
| 2014 | $3,425 | $33,034 | $11,542 | $21,492 |
Source: Public Records
Map
Nearby Homes
- 1305 Balmora St
- 1321 Alexandria St
- 304 W Beacon Hill Dr
- 309 Baron Ave
- 1842 Southard St
- 803 W Lucerne Dr
- 951 Vetch Cir
- 104 Lucerne Dr
- 300 Lucerne Dr
- 1381 Siltstone St
- 411 Levi Ln
- 0 Rainbow Ln
- 2-Story Alley Load Duplex - Butterfly Plan at Silver Creek
- 921 Latigo Loop
- 917 Latigo Loop
- 1331 Fountain Ln
- 1195 Fox Hills Ct
- 926 Hearteye Trail
- 1650 Benjamin Ln
- 736 Gateway Cir
- 3074 Stevens Cir S
- 3096 Stevens Cir S
- 1925 Bell Dr
- 3106 Stevens Cir S
- 3064 Stevens Cir S
- 1930 Bell Dr
- 3067 Stevens Cir S
- 3118 Stevens Cir S
- 1903 Bell Dr
- 3113 Stevens Cir S
- 3052 Stevens Cir S
- 1910 Bell Dr
- 3051 Stevens Cir S
- 3042 Stevens Cir S
- 3129 Stevens Cir S
- 3128 Stevens Cir S
- 1881 Bell Dr
- 3050 Stevens Cir N
- 0 N 111th Unit 627563
- 11070 Arapahoe Rd