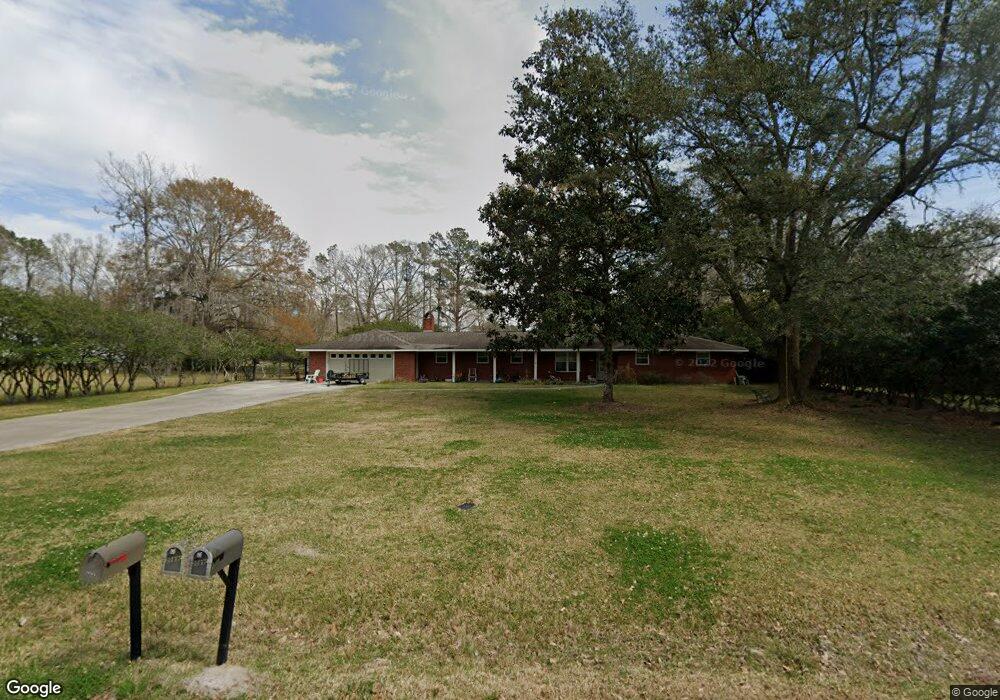
30890 W Knight Dr Denham Springs, LA 70726
Estimated Value: $272,000 - $496,958
3
Beds
3
Baths
2,037
Sq Ft
$185/Sq Ft
Est. Value
About This Home
This home is located at 30890 W Knight Dr, Denham Springs, LA 70726 and is currently estimated at $376,740, approximately $184 per square foot. 30890 W Knight Dr is a home located in Livingston Parish with nearby schools including Freshwater Elementary School, Denham Springs Junior High School, and Denham Springs High School.
Ownership History
Date
Name
Owned For
Owner Type
Purchase Details
Closed on
Aug 29, 2008
Sold by
Montz Wayne V and Montz Sandra Clavin
Bought by
Salter Carter Kevin James and Salter Carter Kattie
Current Estimated Value
Home Financials for this Owner
Home Financials are based on the most recent Mortgage that was taken out on this home.
Original Mortgage
$207,570
Outstanding Balance
$138,195
Interest Rate
6.54%
Mortgage Type
FHA
Estimated Equity
$238,545
Purchase Details
Closed on
Oct 4, 2005
Sold by
Hall Shannon D and Hall Melissa Wiegand
Bought by
Montz Wayne and Montz Sandra Clavin
Home Financials for this Owner
Home Financials are based on the most recent Mortgage that was taken out on this home.
Original Mortgage
$31,800
Interest Rate
8.87%
Mortgage Type
Stand Alone Second
Create a Home Valuation Report for This Property
The Home Valuation Report is an in-depth analysis detailing your home's value as well as a comparison with similar homes in the area
Home Values in the Area
Average Home Value in this Area
Purchase History
| Date | Buyer | Sale Price | Title Company |
|---|---|---|---|
| Salter Carter Kevin James | $219,000 | Choice Title | |
| Montz Wayne | $159,000 | Commerce Title Sherwood |
Source: Public Records
Mortgage History
| Date | Status | Borrower | Loan Amount |
|---|---|---|---|
| Open | Salter Carter Kevin James | $207,570 | |
| Previous Owner | Montz Wayne | $31,800 | |
| Previous Owner | Montz Wayne | $127,200 |
Source: Public Records
Tax History Compared to Growth
Tax History
| Year | Tax Paid | Tax Assessment Tax Assessment Total Assessment is a certain percentage of the fair market value that is determined by local assessors to be the total taxable value of land and additions on the property. | Land | Improvement |
|---|---|---|---|---|
| 2024 | $2,074 | $19,653 | $1,940 | $17,713 |
| 2023 | $1,921 | $16,410 | $1,940 | $14,470 |
| 2022 | $1,934 | $16,410 | $1,940 | $14,470 |
| 2021 | $1,940 | $16,410 | $1,940 | $14,470 |
| 2020 | $1,918 | $16,410 | $1,940 | $14,470 |
| 2019 | $1,715 | $14,480 | $1,940 | $12,540 |
| 2018 | $1,738 | $14,480 | $1,940 | $12,540 |
| 2017 | $1,655 | $13,850 | $1,940 | $11,910 |
| 2015 | $2,011 | $16,800 | $1,940 | $14,860 |
| 2014 | $1,139 | $16,800 | $1,940 | $14,860 |
Source: Public Records
Map
Nearby Homes
- 9091 Lockhart Rd
- 8739 Lockhart Rd Unit 3-F
- 8739 Lockhart Rd Unit 11-E
- 8739 Lockhart Rd Unit 11-F
- 8739 Lockhart Rd Unit 11-D
- 8739 Lockhart Rd Unit 11-C
- 8739 Lockhart Rd Unit 11-B
- 8739 Lockhart Rd Unit 11-A
- 8739 Lockhart Rd Unit 12-D
- 8739 Lockhart Rd Unit 12-E
- 8739 Lockhart Rd Unit 12-C
- 8739 Lockhart Rd Unit 12-B
- 8739 Lockhart Rd Unit 12-A
- 8739 Lockhart Rd Unit 13-A
- 30560 Michelle Ave
- 9136 Carter Cir
- 30641 Shannon Dr
- 30623 Shannon Dr
- 30699 Eden Way Dr
- 30675 Eden Way Dr
- 30880 W Knight Dr
- 30900 W Knight Dr
- 30862 W Knight Dr
- 30862 W Knight Dr
- 30881 E Knight Dr
- 30891 E Knight Dr
- 30877 W Knight Dr
- 30871 E Knight Dr
- 30885 W Knight Dr
- 30895 W Knight Dr
- 30911 E Knight Dr
- 30903 W Knight Dr
- 30863 E Knight Dr
- 30854 W Knight Dr
- 30869 W Knight Dr
- 30939 Walls Ln
- 30849 W Knight Dr
- 30851 E Knight Dr
- 30884 E Knight Dr
- 30874 E Knight Dr