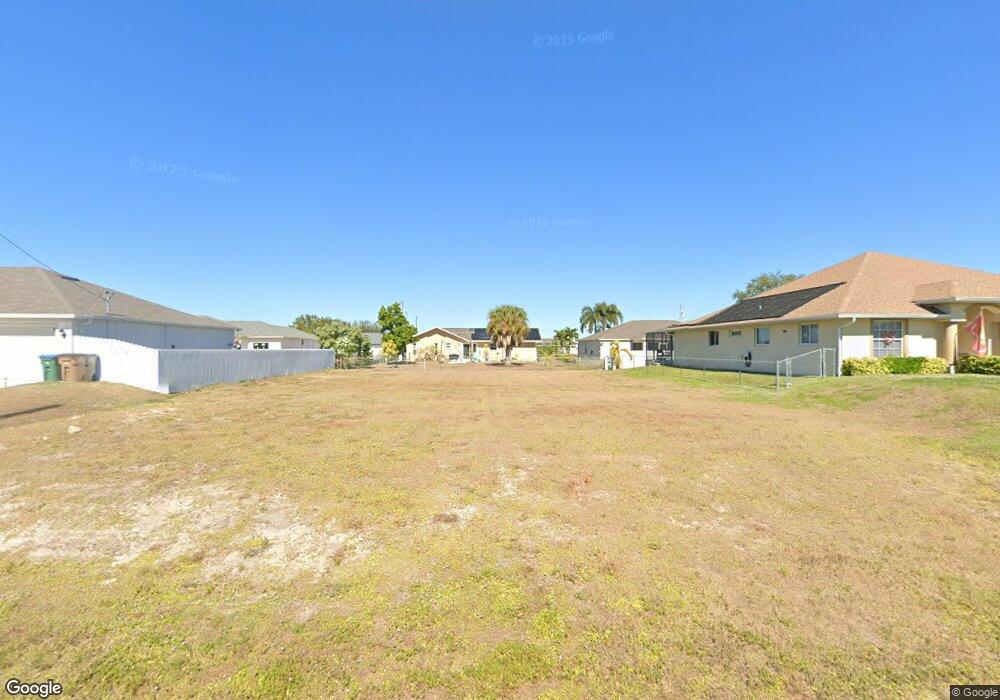
309 20th St NW Cape Coral, FL 33993
Mariner Neighborhood
--
Bed
--
Bath
--
Sq Ft
10,019
Sq Ft Lot
About This Home
This home is located at 309 20th St NW, Cape Coral, FL 33993. 309 20th St NW is a home located in Lee County.
Ownership History
Date
Name
Owned For
Owner Type
Purchase Details
Closed on
Jul 26, 2022
Sold by
Vmp Properties Llc
Bought by
Vmp Scattered Properties Llc
Purchase Details
Closed on
Jul 18, 2022
Sold by
Vmp Properties Llc
Bought by
Vmp Properties Llc
Purchase Details
Closed on
May 10, 2022
Sold by
Cape Coral Development Inc
Bought by
Vaca Properties Llc
Purchase Details
Closed on
Apr 5, 2021
Sold by
Martin Howell B and Martin Herbert G
Bought by
Cape Coral Development Inc
Purchase Details
Closed on
Sep 19, 2006
Sold by
Muller Kim
Bought by
Martin Herbert G and Martin Dena J
Home Financials for this Owner
Home Financials are based on the most recent Mortgage that was taken out on this home.
Original Mortgage
$278,500
Interest Rate
9%
Mortgage Type
Construction
Purchase Details
Closed on
Oct 24, 2004
Sold by
Puschmann Michael
Bought by
Muller Kim
Purchase Details
Closed on
Dec 5, 2003
Sold by
Thomas Helen L
Bought by
Edy William T
Create a Home Valuation Report for This Property
The Home Valuation Report is an in-depth analysis detailing your home's value as well as a comparison with similar homes in the area
Home Values in the Area
Average Home Value in this Area
Purchase History
| Date | Buyer | Sale Price | Title Company |
|---|---|---|---|
| Vmp Scattered Properties Llc | $100 | Bchh Inc | |
| Vmp Properties Llc | -- | None Listed On Document | |
| Vaca Properties Llc | $59,000 | None Listed On Document | |
| Cape Coral Development Inc | $30,000 | Cape Coral Ttl Ins Agcy Inc | |
| Martin Herbert G | $85,000 | Fidelity National Title Ins | |
| Muller Kim | $40,000 | Elite Title Svcs Of Sw Fl | |
| Edy William T | $3,500 | -- |
Source: Public Records
Mortgage History
| Date | Status | Borrower | Loan Amount |
|---|---|---|---|
| Previous Owner | Martin Herbert G | $278,500 |
Source: Public Records
Tax History Compared to Growth
Tax History
| Year | Tax Paid | Tax Assessment Tax Assessment Total Assessment is a certain percentage of the fair market value that is determined by local assessors to be the total taxable value of land and additions on the property. | Land | Improvement |
|---|---|---|---|---|
| 2025 | $1,004 | $32,300 | $32,300 | -- |
| 2024 | $1,017 | $32,138 | $32,138 | -- |
| 2023 | $1,017 | $35,782 | $35,782 | $0 |
| 2022 | $659 | $17,899 | $17,899 | $0 |
| 2021 | $503 | $9,000 | $9,000 | $0 |
| 2020 | $474 | $9,200 | $9,200 | $0 |
| 2019 | $453 | $10,500 | $10,500 | $0 |
| 2018 | $444 | $10,500 | $10,500 | $0 |
| 2017 | $415 | $10,821 | $10,821 | $0 |
| 2016 | $362 | $6,800 | $6,800 | $0 |
| 2015 | $331 | $6,300 | $6,300 | $0 |
| 2014 | $270 | $5,640 | $5,640 | $0 |
| 2013 | -- | $3,900 | $3,900 | $0 |
Source: Public Records
Map
Nearby Homes
- 308 NW 20th Terrace
- 314 NW 20th Terrace
- 2009 NW 3rd Ave
- 322 NW 20th St
- 2015 NW 3rd Ave
- 2021 NW 2nd Place
- 209 NW 19th Terrace
- 1902 NW 2nd Place
- 2032 NW 2nd Place
- 409 NW 19th Terrace
- 316 NW 19th St
- 1825 NW 3rd Ave
- 305 NW 21st St
- 122 NW 20th St
- 2108 NW 2nd Place
- 2107 NW 2nd Place
- 1820 NW 2nd Ave
- 419 NW 19th St
- 504 NW 20th St
- 522 NW 20th St
- 313 NW 20th St
- 305 NW 20th St
- 304 NW 20th Terrace
- 319 NW 20th St
- 310 NW 20th St
- 310 NW 20th Terrace
- 306 NW 20th St
- 314 NW 20th St
- 300 NW 20th Terrace
- 302 NW 20th Terrace
- 302 NW 20th St Unit 39
- 318 NW 20th Terrace
- 318 NW 20th St
- 323 NW 20th St
- 212 NW 20th St
- 322 NW 20th Terrace
- 309 NW 20th Terrace
- 322 NW 20th Te
- 2001 NW 3rd Ave
- 2005 NW 3rd Ave