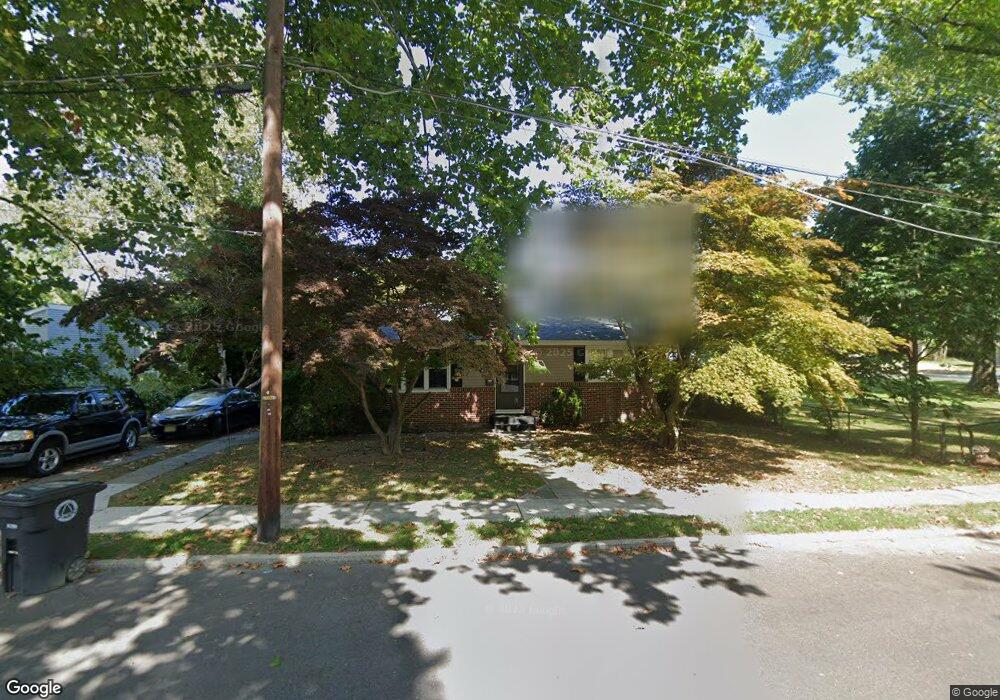
309 4th Ave Lindenwold, NJ 08021
Estimated Value: $232,000 - $254,087
--
Bed
--
Bath
1,008
Sq Ft
$245/Sq Ft
Est. Value
About This Home
This home is located at 309 4th Ave, Lindenwold, NJ 08021 and is currently estimated at $246,522, approximately $244 per square foot. 309 4th Ave is a home located in Camden County with nearby schools including Lindenwold High School, South Jersey Sudbury School, and Trinity Preparatory School Inc..
Ownership History
Date
Name
Owned For
Owner Type
Purchase Details
Closed on
Aug 30, 2006
Sold by
Smith Montez L
Bought by
Webster Loren and Webster Aaron
Current Estimated Value
Home Financials for this Owner
Home Financials are based on the most recent Mortgage that was taken out on this home.
Original Mortgage
$137,026
Outstanding Balance
$82,469
Interest Rate
6.71%
Mortgage Type
FHA
Estimated Equity
$164,053
Purchase Details
Closed on
Feb 23, 2001
Sold by
Tiralli Frederick J
Bought by
Smith Montez L
Home Financials for this Owner
Home Financials are based on the most recent Mortgage that was taken out on this home.
Original Mortgage
$75,000
Interest Rate
7%
Mortgage Type
FHA
Create a Home Valuation Report for This Property
The Home Valuation Report is an in-depth analysis detailing your home's value as well as a comparison with similar homes in the area
Home Values in the Area
Average Home Value in this Area
Purchase History
| Date | Buyer | Sale Price | Title Company |
|---|---|---|---|
| Webster Loren | $140,000 | -- | |
| Smith Montez L | $76,200 | -- |
Source: Public Records
Mortgage History
| Date | Status | Borrower | Loan Amount |
|---|---|---|---|
| Open | Webster Loren | $137,026 | |
| Previous Owner | Smith Montez L | $75,000 |
Source: Public Records
Tax History Compared to Growth
Tax History
| Year | Tax Paid | Tax Assessment Tax Assessment Total Assessment is a certain percentage of the fair market value that is determined by local assessors to be the total taxable value of land and additions on the property. | Land | Improvement |
|---|---|---|---|---|
| 2025 | $4,871 | $98,500 | $37,500 | $61,000 |
| 2024 | $4,897 | $98,500 | $37,500 | $61,000 |
| 2023 | $4,897 | $98,500 | $37,500 | $61,000 |
| 2022 | $4,893 | $98,500 | $37,500 | $61,000 |
| 2021 | $4,648 | $98,500 | $37,500 | $61,000 |
| 2020 | $4,998 | $98,500 | $37,500 | $61,000 |
| 2019 | $5,042 | $98,500 | $37,500 | $61,000 |
| 2018 | $5,029 | $98,500 | $37,500 | $61,000 |
| 2017 | $4,879 | $98,500 | $37,500 | $61,000 |
| 2016 | $4,769 | $98,500 | $37,500 | $61,000 |
| 2015 | $4,568 | $98,500 | $37,500 | $61,000 |
| 2014 | $4,369 | $98,500 | $37,500 | $61,000 |
Source: Public Records
Map
Nearby Homes
- 335 2nd Ave
- 118 1st Ave
- 409 9th Ave
- 37 Pine Grove Ave
- 427 W Maple Ave
- 531 6th Ave
- 524 8th Ave
- 605 4th Ave
- 312 Wallace Ave
- 42 Trowbridge Ln Unit DD
- 116 W Park Ave
- 514 Park Ave
- 104 W Park Ave
- 316 E Stafford Ave
- 1501-1521 Chews Landing Rd
- 36 Chiswick Dr
- 32 Chiswick Dr
- 2004 Greenwood Dr
- 1802 Greenwood Dr
- 2005 Greenwood Dr