Estimated Value: $104,000 - $155,000
3
Beds
2
Baths
1,092
Sq Ft
$113/Sq Ft
Est. Value
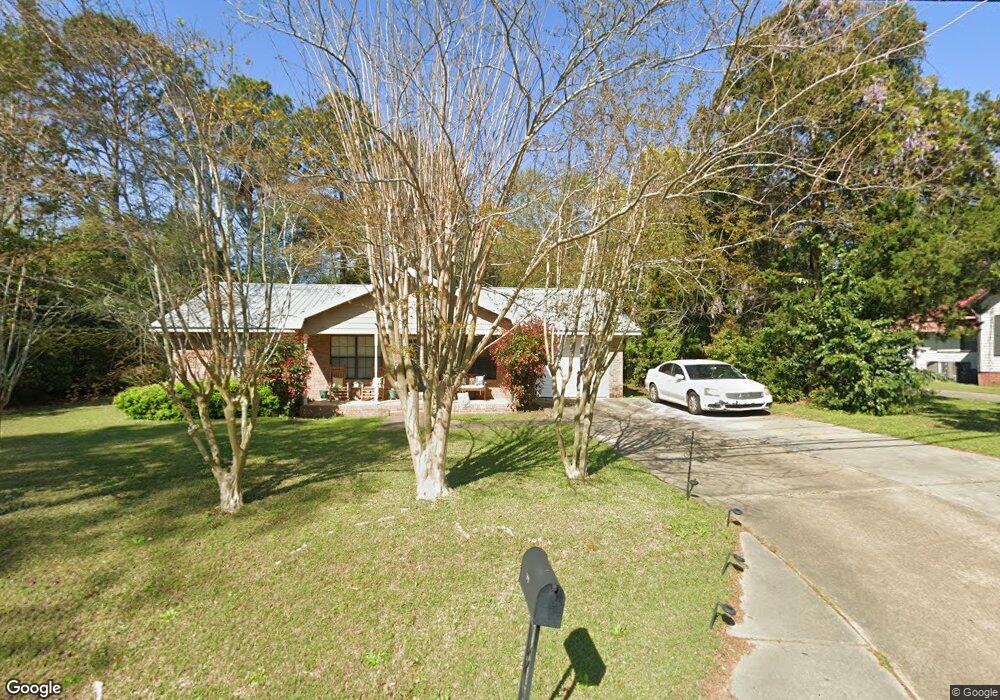
About This Home
This home is located at 309 4th St NE, Cairo, GA 39828 and is currently estimated at $123,474, approximately $113 per square foot. 309 4th St NE is a home located in Grady County with nearby schools including Cairo High School.
Ownership History
Date
Name
Owned For
Owner Type
Purchase Details
Closed on
Jul 17, 2015
Sold by
Dancer Luther A
Bought by
Edwards Tijwanna
Current Estimated Value
Home Financials for this Owner
Home Financials are based on the most recent Mortgage that was taken out on this home.
Original Mortgage
$77,800
Outstanding Balance
$63,638
Interest Rate
4.04%
Mortgage Type
New Conventional
Estimated Equity
$59,836
Purchase Details
Closed on
Jan 23, 2008
Sold by
Flower Billy F
Bought by
Dancer Luther A and Dancer Sharon L
Purchase Details
Closed on
Mar 6, 2007
Sold by
Taylor Samuel
Bought by
Flowers Billy F and Flowers Mary E
Purchase Details
Closed on
Mar 14, 2003
Sold by
Flowers Bill
Bought by
Taylor Samuel and Taylor Suprina
Purchase Details
Closed on
Mar 12, 2003
Sold by
Henderson Susie
Bought by
Flowers Bill
Purchase Details
Closed on
Dec 4, 1992
Sold by
Robbie Burns Construction Inc
Bought by
Henderson Susie
Create a Home Valuation Report for This Property
The Home Valuation Report is an in-depth analysis detailing your home's value as well as a comparison with similar homes in the area
Home Values in the Area
Average Home Value in this Area
Purchase History
| Date | Buyer | Sale Price | Title Company |
|---|---|---|---|
| Edwards Tijwanna | $77,000 | -- | |
| Dancer Luther A | $76,250 | -- | |
| Flowers Billy F | -- | -- | |
| Taylor Samuel | $72,000 | -- | |
| Flowers Bill | -- | -- | |
| Henderson Susie | $49,500 | -- |
Source: Public Records
Mortgage History
| Date | Status | Borrower | Loan Amount |
|---|---|---|---|
| Open | Edwards Tijwanna | $77,800 |
Source: Public Records
Tax History Compared to Growth
Tax History
| Year | Tax Paid | Tax Assessment Tax Assessment Total Assessment is a certain percentage of the fair market value that is determined by local assessors to be the total taxable value of land and additions on the property. | Land | Improvement |
|---|---|---|---|---|
| 2024 | $1,574 | $39,883 | $4,660 | $35,223 |
| 2023 | $1,187 | $32,056 | $4,002 | $28,054 |
| 2022 | $1,234 | $32,056 | $4,002 | $28,054 |
| 2021 | $1,238 | $32,056 | $4,002 | $28,054 |
| 2020 | $1,241 | $32,056 | $4,002 | $28,054 |
| 2019 | $1,241 | $32,056 | $4,002 | $28,054 |
| 2018 | $1,179 | $32,056 | $4,002 | $28,054 |
| 2017 | $1,134 | $32,056 | $4,002 | $28,054 |
| 2016 | $988 | $27,305 | $4,002 | $23,302 |
| 2015 | $978 | $27,305 | $4,002 | $23,302 |
| 2014 | $978 | $27,305 | $4,002 | $23,302 |
| 2013 | -- | $24,330 | $4,002 | $20,328 |
Source: Public Records
Map
Nearby Homes
- 4761 Hadley Ferry Rd
- 711 2nd Ave NE
- 2975 U S 84
- X 1st St
- 00 Hwy 111 South Tract 1
- 316,322 NW 1st St + Lot
- 0 1st St
- 309 3rd St SE
- 125 6th Ave NW
- 00 NW 9th Ave
- 00 00 Hwy 111 South Tract 2
- 471 4th St SE
- 481 4th St SE
- 000 S Broad St
- 220 8th Ave NW
- 000 Hwy 111 South 20 59 Acres
- 602 4th St SE
- 40 5th Ave SW
- 530 6th Ave SE
- 117 6th St SW
- 309 4th St NE
- 401 4th St NE
- 308 4th St NE
- 318 4th St NE
- 411 4th St NE
- 406 4th St NE
- 408 4th Ave NE
- 419 4th St NE
- 417 4th Ave NE
- 418 4th St NE
- 410 4th Ave NE
- 416 4th Ave NE
- Lot 7 Oak Bend Subdivision
- Lot 7 Oak Bend Subdivision Unit 7
- 420 4th St NE
- 311 5th St SE
- 314 3rd St NE
- 412 5th Ave NE
- 316 3rd St NE
- 308 3rd St NE