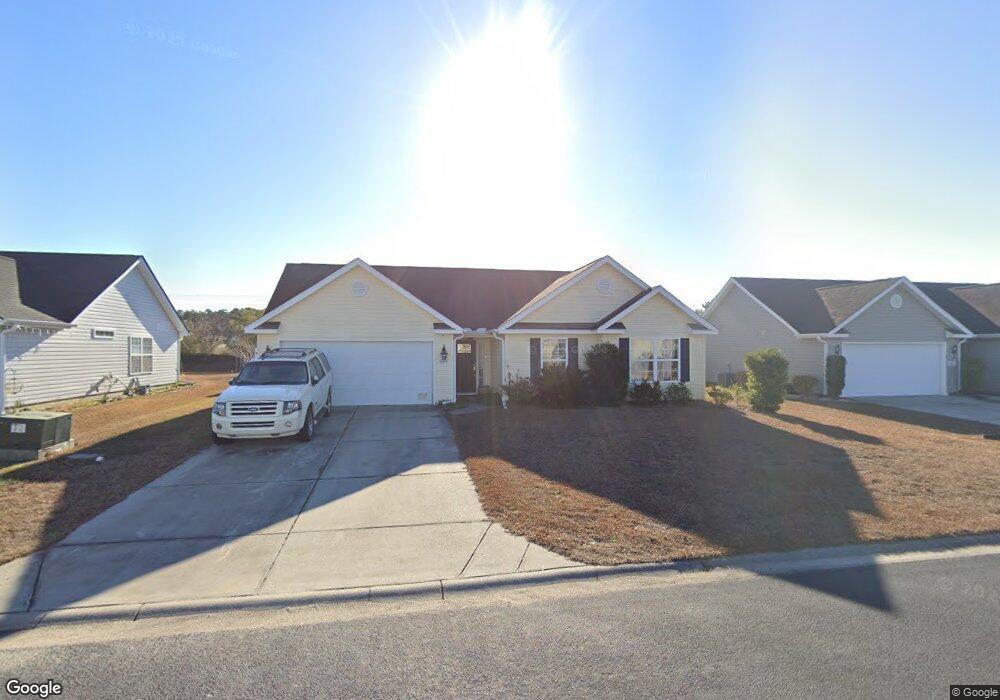
309 Barton Loop Myrtle Beach, SC 29579
Estimated Value: $269,618 - $287,000
3
Beds
2
Baths
1,536
Sq Ft
$182/Sq Ft
Est. Value
About This Home
This home is located at 309 Barton Loop, Myrtle Beach, SC 29579 and is currently estimated at $280,155, approximately $182 per square foot. 309 Barton Loop is a home located in Horry County with nearby schools including River Oaks Elementary School, Ten Oaks Middle, and Carolina Forest High School.
Ownership History
Date
Name
Owned For
Owner Type
Purchase Details
Closed on
Aug 25, 2022
Sold by
Thompson Philip Coleman
Bought by
Webber Michael Patrick
Current Estimated Value
Home Financials for this Owner
Home Financials are based on the most recent Mortgage that was taken out on this home.
Original Mortgage
$266,885
Outstanding Balance
$254,009
Interest Rate
5.62%
Mortgage Type
FHA
Estimated Equity
$26,146
Purchase Details
Closed on
Jan 29, 2021
Sold by
Thompson Patricia N
Bought by
Thompson Philip Coleman and Thompson Karishma Nichol
Home Financials for this Owner
Home Financials are based on the most recent Mortgage that was taken out on this home.
Original Mortgage
$100,000
Interest Rate
2.6%
Mortgage Type
New Conventional
Purchase Details
Closed on
Mar 12, 2014
Sold by
Wooten Christopher M
Bought by
Thompson Patricia N
Purchase Details
Closed on
Feb 16, 2010
Sold by
Southern Land Partners Inc
Bought by
Wooten Christopher M
Purchase Details
Closed on
Feb 8, 2010
Sold by
Dash Development Inc
Bought by
Southern Land Partners Inc
Create a Home Valuation Report for This Property
The Home Valuation Report is an in-depth analysis detailing your home's value as well as a comparison with similar homes in the area
Home Values in the Area
Average Home Value in this Area
Purchase History
| Date | Buyer | Sale Price | Title Company |
|---|---|---|---|
| Webber Michael Patrick | $276,100 | -- | |
| Thompson Philip Coleman | $130,000 | -- | |
| Thompson Patricia N | $133,500 | -- | |
| Wooten Christopher M | $130,750 | -- | |
| Southern Land Partners Inc | $37,500 | -- |
Source: Public Records
Mortgage History
| Date | Status | Borrower | Loan Amount |
|---|---|---|---|
| Open | Webber Michael Patrick | $266,885 | |
| Previous Owner | Thompson Philip Coleman | $100,000 |
Source: Public Records
Tax History
| Year | Tax Paid | Tax Assessment Tax Assessment Total Assessment is a certain percentage of the fair market value that is determined by local assessors to be the total taxable value of land and additions on the property. | Land | Improvement |
|---|---|---|---|---|
| 2025 | $3,114 | $0 | $0 | $0 |
| 2024 | $3,114 | $10,036 | $3,046 | $6,990 |
| 2023 | $3,114 | $6,038 | $1,411 | $4,627 |
| 2021 | $1,914 | $6,467 | $1,411 | $5,056 |
| 2020 | $1,903 | $9,700 | $2,116 | $7,584 |
| 2019 | $1,903 | $9,700 | $2,116 | $7,584 |
| 2018 | $1,720 | $7,876 | $1,960 | $5,916 |
| 2017 | $1,705 | $7,876 | $1,960 | $5,916 |
| 2016 | $0 | $7,876 | $1,960 | $5,916 |
| 2015 | -- | $7,876 | $1,960 | $5,916 |
| 2014 | $462 | $7,876 | $1,960 | $5,916 |
Source: Public Records
Map
Nearby Homes
- 374 Barton Loop
- 713 Kennoway Ct
- 337 Golan Cir Unit C
- 434 Barton Loop
- 200 Yam Dr Unit F
- 1991 Mossy Point Cove Unit 1991
- 1113 Peace Pipe Place Unit 203
- 1101 Peace Pipe Place Unit 104
- 1121 Peace Pipe Place Unit 204
- 143 Clovis Cir
- 301 Granada St Unit D
- 3534 Gordon Dr
- 1133 Peace Pipe Place Unit 102
- 1141 Peace Pipe Place Unit 101
- 1141 Peace Pipe Place Unit 102
- 1141 Peace Pipe Place Unit 201
- 404 El Camino Dr Unit B
- 608 Montenegro Way Unit C
- 608 Montenegro Way Unit A
- 608 Montenegro Way Unit D
- 305 Barton Loop
- 313 Barton Loop
- 317 Barton Loop
- 301 Barton Loop Unit Lt 4
- 324 Barton Loop
- 308 Barton Loop
- 501 Bagley Dr
- 321 Barton Loop
- 334 Barton Loop
- 119 Bonnie Bridge Cir
- 505 Bagley Dr
- 325 Barton Loop
- 127 Bonnie Bridge Cir
- 115 Bonnie Bridge Cir
- 123 Bonnie Bridge Cir
- 329 Barton Loop
- 200 Ackerman Dr
- 131 Bonnie Bridge Cir
- 338 Barton Loop
- 109 Bonnie Bridge Cir
Your Personal Tour Guide
Ask me questions while you tour the home.