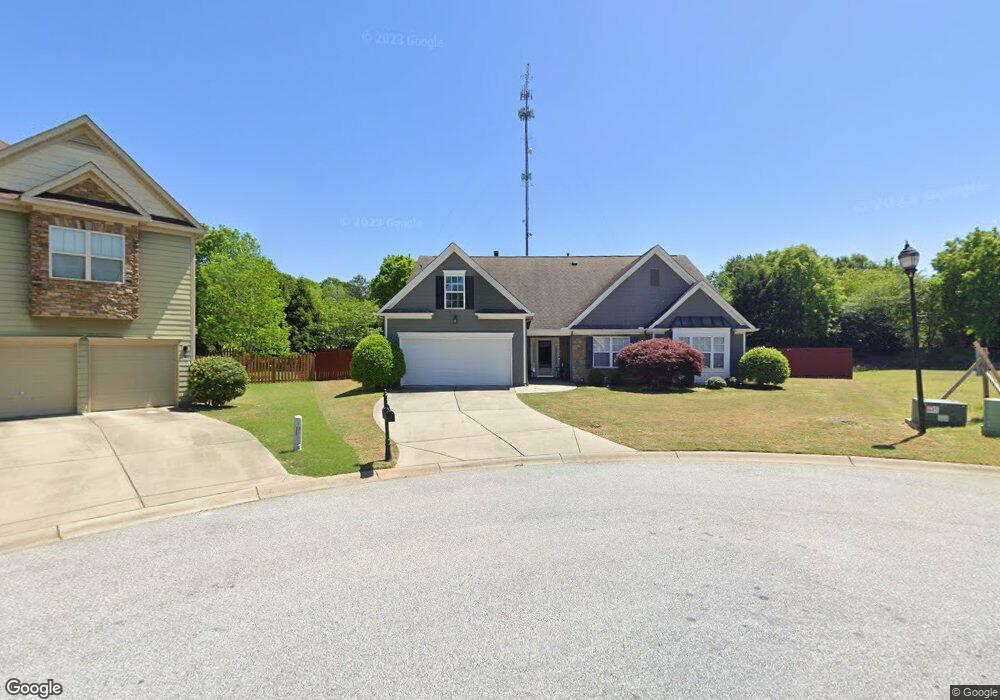
309 Callipoe Ct Simpsonville, SC 29681
Estimated Value: $430,797 - $455,000
3
Beds
3
Baths
2,822
Sq Ft
$157/Sq Ft
Est. Value
About This Home
This home is located at 309 Callipoe Ct, Simpsonville, SC 29681 and is currently estimated at $441,949, approximately $156 per square foot. 309 Callipoe Ct is a home located in Greenville County with nearby schools including Simpsonville Elementary, Hillcrest Middle School, and Hillcrest High School.
Ownership History
Date
Name
Owned For
Owner Type
Purchase Details
Closed on
Sep 2, 2021
Sold by
Stanton Danielle Carol Deranieri and Stanton Danielle C
Bought by
Stanton Danielle Carol Deranieri
Current Estimated Value
Home Financials for this Owner
Home Financials are based on the most recent Mortgage that was taken out on this home.
Original Mortgage
$194,108
Outstanding Balance
$176,360
Interest Rate
2.7%
Mortgage Type
FHA
Estimated Equity
$265,589
Purchase Details
Closed on
Mar 22, 2016
Sold by
Deranieri Danielle C and Stanton Danielle C
Bought by
Stanton Danielle C
Purchase Details
Closed on
May 1, 2009
Sold by
Deranieri Danielle C
Bought by
Deranieri Danielle C and Stanton Robert D
Purchase Details
Closed on
Aug 28, 2008
Sold by
Arlington Builders Llc
Bought by
Deranieri Danielle C
Home Financials for this Owner
Home Financials are based on the most recent Mortgage that was taken out on this home.
Original Mortgage
$230,995
Interest Rate
6.21%
Mortgage Type
Purchase Money Mortgage
Create a Home Valuation Report for This Property
The Home Valuation Report is an in-depth analysis detailing your home's value as well as a comparison with similar homes in the area
Home Values in the Area
Average Home Value in this Area
Purchase History
| Date | Buyer | Sale Price | Title Company |
|---|---|---|---|
| Stanton Danielle Carol Deranieri | -- | Avenue 365 Lender Svcs Llc | |
| Stanton Danielle C | -- | None Available | |
| Deranieri Danielle C | -- | -- | |
| Deranieri Danielle C | $256,690 | -- |
Source: Public Records
Mortgage History
| Date | Status | Borrower | Loan Amount |
|---|---|---|---|
| Open | Stanton Danielle Carol Deranieri | $194,108 | |
| Closed | Deranieri Danielle C | $230,995 |
Source: Public Records
Tax History Compared to Growth
Tax History
| Year | Tax Paid | Tax Assessment Tax Assessment Total Assessment is a certain percentage of the fair market value that is determined by local assessors to be the total taxable value of land and additions on the property. | Land | Improvement |
|---|---|---|---|---|
| 2024 | $1,632 | $10,350 | $1,380 | $8,970 |
| 2023 | $1,632 | $10,350 | $1,380 | $8,970 |
| 2022 | $1,591 | $10,350 | $1,380 | $8,970 |
| 2021 | $1,592 | $10,350 | $1,380 | $8,970 |
| 2020 | $1,560 | $9,660 | $1,280 | $8,380 |
| 2019 | $1,561 | $9,660 | $1,280 | $8,380 |
| 2018 | $1,613 | $9,660 | $1,280 | $8,380 |
| 2017 | $1,615 | $9,660 | $1,280 | $8,380 |
| 2016 | $1,558 | $241,500 | $32,000 | $209,500 |
| 2015 | $1,708 | $241,500 | $32,000 | $209,500 |
| 2014 | $1,422 | $230,750 | $47,000 | $183,750 |
Source: Public Records
Map
Nearby Homes
- 221 Blue Danube Dr
- 114 Cross Arbor Dr
- 416 Bridge Crossing Dr
- 415 Bridge Crossing Dr
- 508 Pennystone Ln
- Cary Plan at Riverbrooke Townhomes
- Ashland Plan at Riverbrooke Townhomes
- Bristol Plan at Riverbrooke Townhomes
- 604 Autumn Lake Rd
- 518 Pennystone Ln
- 520 Pennystone Ln
- 615 Autumn Lake Rd
- 617 Autumn Lake Rd
- 619 Autumn Lake Rd
- 611 Autumn Lake Rd
- 204 Whitworth Way
- 99 Wemberly Ln
- 101 Twomey Cir
- 8 Gressette Place
- 14 Gressette Place
- 305 Callipoe Ct
- 308 Callipoe Ct
- 101 Ponderosa Dr
- 304 Callipoe Ct
- 201 Red Orchid Rd
- 205 Red Orchid Rd
- 14 Delgado Way
- 100 Red Orchid Rd
- 10 Delgado Way
- 200 Red Orchid Rd
- 108 Red Orchid Rd
- 104 Red Orchid Rd
- 209 Red Orchid Rd
- 100 Red Orchid Rd
- 9 Delgado Way
- 6 Delgado Way
- 204 Red Orchid Rd
- 213 Red Orchid Rd
- 2 Delgado Way
- 5 Delgado Way