J
Seller's Agent in 2025
Jason Gallman
Virtual Properties Realty.NET
(404) 314-1195
1 in this area
5 Total Sales
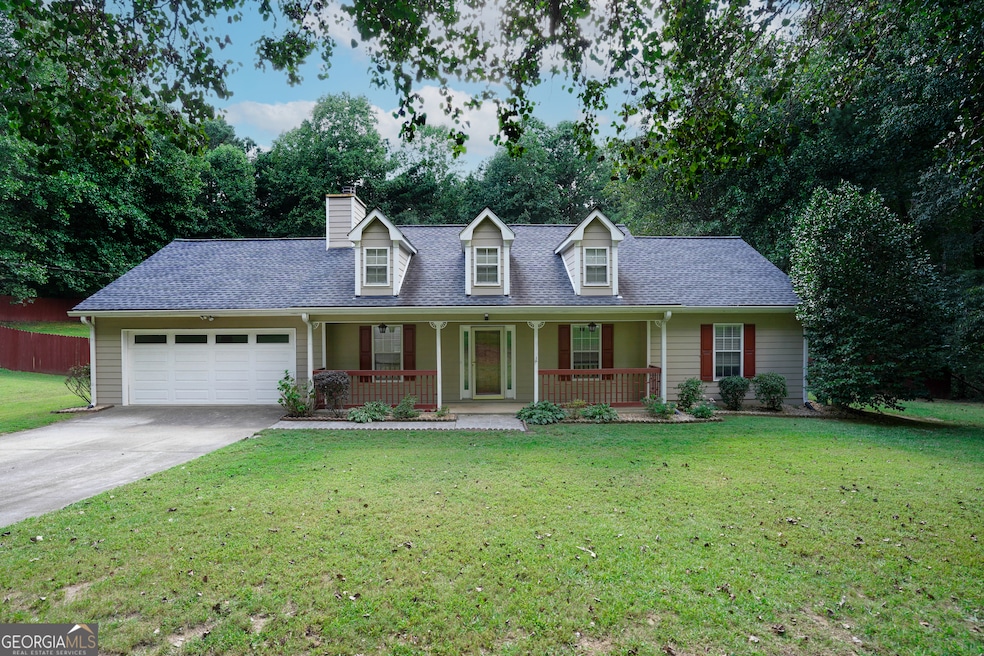
Beautiful Step-Less Ranch close to everything. Huge backyard with Privacy fence big enough for any Family activity. Tile floors throughout. Newer Roof 2020, New HVAC unit 2025, Fresh Exterior Paint 2020, and Newer H20 Heater 2019. Open Family Room with plenty of natural light. Covered Front Sitting Area. Backyard has a shed and a large concrete pad for outdoor grilling and entertaining.
Last Agent to Sell the Property
Virtual Properties Realty.Net License #312983 Listed on: 09/05/2025

| Date | Type | Sale Price | Title Company |
|---|---|---|---|
| Warranty Deed | -- | -- | |
| Warranty Deed | $350,000 | -- | |
| Deed | $117,000 | -- | |
| Deed | $91,900 | -- | |
| Deed | $91,900 | -- | |
| Deed | $12,000 | -- |
| Date | Status | Loan Amount | Loan Type |
|---|---|---|---|
| Open | $332,500 | New Conventional | |
| Previous Owner | $105,200 | New Conventional | |
| Previous Owner | $82,700 | New Conventional |
| Date | Event | Price | List to Sale | Price per Sq Ft |
|---|---|---|---|---|
| 12/12/2025 12/12/25 | Sold | $350,000 | 0.0% | $260 / Sq Ft |
| 11/14/2025 11/14/25 | Pending | -- | -- | -- |
| 09/05/2025 09/05/25 | For Sale | $350,000 | -- | $260 / Sq Ft |
| Year | Tax Paid | Tax Assessment Tax Assessment Total Assessment is a certain percentage of the fair market value that is determined by local assessors to be the total taxable value of land and additions on the property. | Land | Improvement |
|---|---|---|---|---|
| 2025 | $2,670 | $103,114 | $24,000 | $79,114 |
| 2024 | $2,658 | $100,846 | $24,000 | $76,846 |
| 2023 | $1,717 | $100,846 | $24,000 | $76,846 |
| 2022 | $1,673 | $65,066 | $18,400 | $46,666 |
| 2021 | $1,525 | $54,541 | $12,800 | $41,741 |
| 2020 | $1,488 | $52,899 | $12,800 | $40,099 |
| 2019 | $1,433 | $49,616 | $12,800 | $36,816 |
| 2018 | $1,274 | $43,533 | $10,000 | $33,533 |
| 2017 | $204 | $37,334 | $10,000 | $27,334 |
| 2016 | $1,021 | $36,310 | $10,000 | $26,310 |
| 2015 | $1,043 | $36,928 | $10,000 | $26,928 |
| 2014 | $942 | $35,297 | $6,664 | $28,633 |
| 2013 | -- | $33,945 | $6,664 | $27,281 |
J
Seller's Agent in 2025
Jason Gallman
Virtual Properties Realty.NET
(404) 314-1195
1 in this area
5 Total Sales
Buyer's Agent in 2025
Jesus Cardoza
Virtual Properties Realty.NET
(678) 855-3595
1 in this area
35 Total Sales
Source: Georgia MLS
MLS Number: 10599310
APN: AU13A-119
Disclaimer: Certain information contained herein is derived from information provided by parties other than Homes.com. All information provided is deemed reliable, but is not guaranteed to be accurate and should be independently verified.
![]() The data relating to real estate for sale on this web site comes in part from the Broker Reciprocity Program of Georgia MLS. Real estate listings held by brokerage firms other than Redfin are marked with the Broker Reciprocity logo and detailed information about them includes the name of the listing brokers. Information deemed reliable but not guaranteed. Copyright 2026 Georgia MLS. All rights reserved.
The data relating to real estate for sale on this web site comes in part from the Broker Reciprocity Program of Georgia MLS. Real estate listings held by brokerage firms other than Redfin are marked with the Broker Reciprocity logo and detailed information about them includes the name of the listing brokers. Information deemed reliable but not guaranteed. Copyright 2026 Georgia MLS. All rights reserved.
Ask me questions while you tour the home.