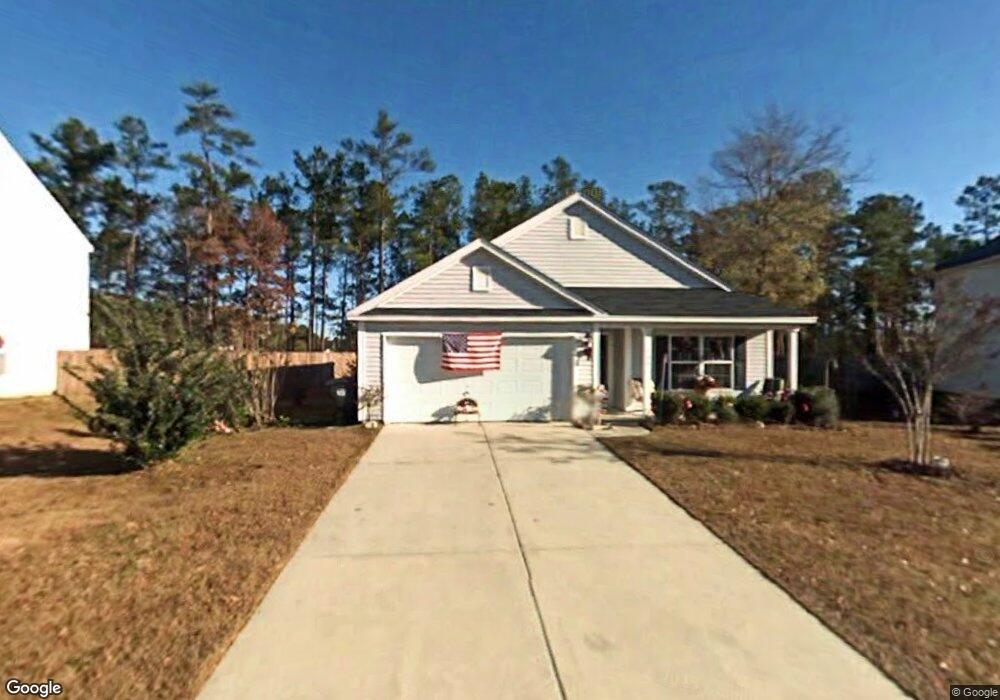
309 Cohen Cir Ladson, SC 29456
Estimated Value: $286,096 - $327,000
3
Beds
2
Baths
1,539
Sq Ft
$203/Sq Ft
Est. Value
About This Home
This home is located at 309 Cohen Cir, Ladson, SC 29456 and is currently estimated at $312,024, approximately $202 per square foot. 309 Cohen Cir is a home located in Berkeley County with nearby schools including Sangaree Elementary School, Sangaree Intermediate School, and Sangaree Middle School.
Ownership History
Date
Name
Owned For
Owner Type
Purchase Details
Closed on
Jun 29, 2009
Sold by
Stepniewska T and The Hawthorne Place Family Tru
Bought by
Grimes Derrick A
Current Estimated Value
Home Financials for this Owner
Home Financials are based on the most recent Mortgage that was taken out on this home.
Original Mortgage
$124,623
Outstanding Balance
$78,485
Interest Rate
4.79%
Mortgage Type
VA
Estimated Equity
$233,539
Purchase Details
Closed on
May 27, 2008
Sold by
Tootle K L and Hawthorne Place Family Trust
Bought by
Stepniewska T and Hawthorne Place Family Trust
Purchase Details
Closed on
Oct 24, 2006
Sold by
Stepniewska Teresa
Bought by
Tootle K L and Hawthorne Place Family Trust
Purchase Details
Closed on
Aug 5, 2003
Sold by
Beazer Homes Corp
Bought by
Stepniewska Teresa
Purchase Details
Closed on
Mar 4, 2002
Sold by
Ward Johnny and Gaskins Cohen
Bought by
Beazer Homes Corp
Create a Home Valuation Report for This Property
The Home Valuation Report is an in-depth analysis detailing your home's value as well as a comparison with similar homes in the area
Home Values in the Area
Average Home Value in this Area
Purchase History
| Date | Buyer | Sale Price | Title Company |
|---|---|---|---|
| Grimes Derrick A | $122,000 | -- | |
| Stepniewska T | -- | -- | |
| Tootle K L | -- | None Available | |
| Stepniewska Teresa | $126,590 | -- | |
| Beazer Homes Corp | $300,000 | -- |
Source: Public Records
Mortgage History
| Date | Status | Borrower | Loan Amount |
|---|---|---|---|
| Open | Grimes Derrick A | $124,623 |
Source: Public Records
Tax History Compared to Growth
Tax History
| Year | Tax Paid | Tax Assessment Tax Assessment Total Assessment is a certain percentage of the fair market value that is determined by local assessors to be the total taxable value of land and additions on the property. | Land | Improvement |
|---|---|---|---|---|
| 2025 | $803 | $160,948 | $27,213 | $133,735 |
| 2024 | $763 | $6,438 | $1,089 | $5,349 |
| 2023 | $763 | $6,438 | $1,089 | $5,349 |
| 2022 | $763 | $5,598 | $979 | $4,619 |
| 2021 | $781 | $5,600 | $979 | $4,619 |
| 2020 | $790 | $5,598 | $979 | $4,619 |
| 2019 | $785 | $5,598 | $979 | $4,619 |
| 2018 | $736 | $4,868 | $1,280 | $3,588 |
| 2017 | $697 | $4,868 | $1,280 | $3,588 |
| 2016 | $712 | $4,870 | $1,280 | $3,590 |
| 2015 | $662 | $4,870 | $1,280 | $3,590 |
| 2014 | $651 | $4,870 | $1,280 | $3,590 |
| 2013 | -- | $4,870 | $1,280 | $3,590 |
Source: Public Records
Map
Nearby Homes
- 306 Sundial Ln
- 100 Trescott Ct
- 154 Fern Ct
- 109 Wisteria Ct
- 100 Photinia Ct
- 414 Courtland Dr
- 482 Courtland Dr
- 114 Tennyson Way
- 2062 Clipstone Dr
- 3033 Kinswood Ln
- 1059 Friartuck Trail
- 107 Broken Trail
- 234 Ponderosa Dr
- 2003 Wishing Well Trail
- 104 Hialeah Ct
- 137 Paddock Way
- 106 Hialeah Ct
- 120 Eaton Way
- 101 Ohio Way
- 212 Trestlewood Dr