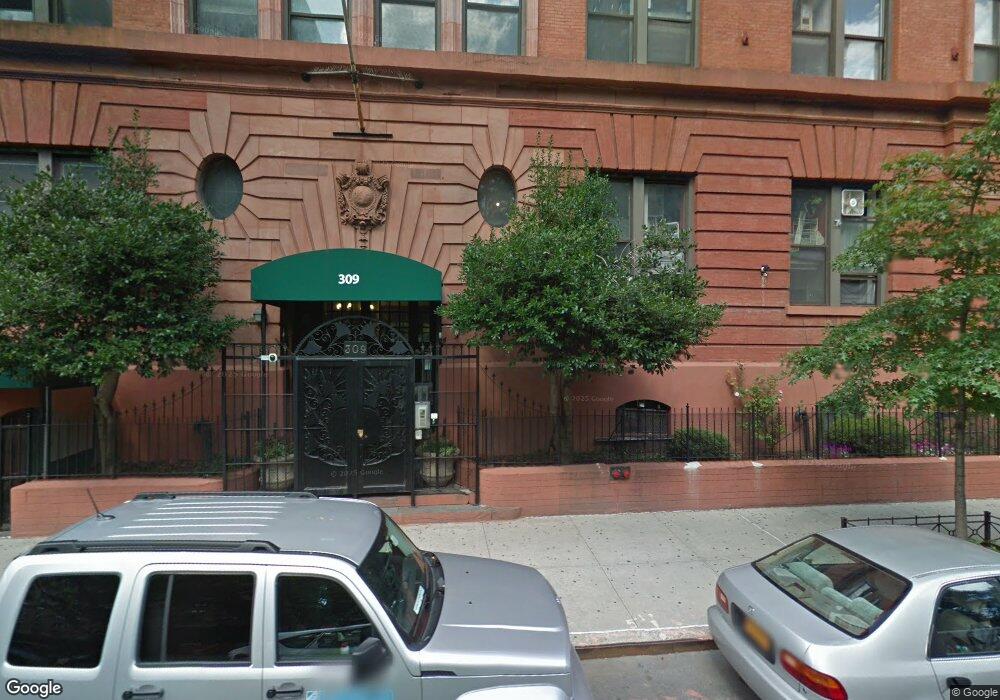
309 E 108th St Unit 3F New York, NY 10029
East Harlem NeighborhoodEstimated Value: $746,848 - $982,000
Studio
--
Bath
1,257
Sq Ft
$677/Sq Ft
Est. Value
About This Home
This home is located at 309 E 108th St Unit 3F, New York, NY 10029 and is currently estimated at $850,962, approximately $676 per square foot. 309 E 108th St Unit 3F is a home located in New York County with nearby schools including P.S. 146 Ann M Short, Isaac Newton Ms For Math And Science, and Global Technology Preparatory.
Ownership History
Date
Name
Owned For
Owner Type
Purchase Details
Closed on
Nov 29, 2005
Sold by
Cuneo Charles R
Bought by
Ynostroza Judith R and Ynostroza Roger
Current Estimated Value
Home Financials for this Owner
Home Financials are based on the most recent Mortgage that was taken out on this home.
Original Mortgage
$450,000
Outstanding Balance
$252,526
Interest Rate
6.34%
Mortgage Type
Purchase Money Mortgage
Estimated Equity
$598,436
Purchase Details
Closed on
Nov 10, 2004
Sold by
Berger David and Berger Harold
Bought by
Cuneo Charles R
Home Financials for this Owner
Home Financials are based on the most recent Mortgage that was taken out on this home.
Original Mortgage
$499,000
Interest Rate
5.75%
Mortgage Type
Purchase Money Mortgage
Purchase Details
Closed on
Aug 14, 2001
Sold by
Aleppo Pine Llc
Bought by
Berger David and Berger Harold
Home Financials for this Owner
Home Financials are based on the most recent Mortgage that was taken out on this home.
Original Mortgage
$275,000
Interest Rate
7.05%
Create a Home Valuation Report for This Property
The Home Valuation Report is an in-depth analysis detailing your home's value as well as a comparison with similar homes in the area
Home Values in the Area
Average Home Value in this Area
Purchase History
| Date | Buyer | Sale Price | Title Company |
|---|---|---|---|
| Ynostroza Judith R | $799,000 | -- | |
| Cuneo Charles R | $575,000 | -- | |
| Berger David | -- | -- |
Source: Public Records
Mortgage History
| Date | Status | Borrower | Loan Amount |
|---|---|---|---|
| Open | Ynostroza Judith R | $450,000 | |
| Previous Owner | Cuneo Charles R | $499,000 | |
| Previous Owner | Berger David | $275,000 |
Source: Public Records
Tax History
| Year | Tax Paid | Tax Assessment Tax Assessment Total Assessment is a certain percentage of the fair market value that is determined by local assessors to be the total taxable value of land and additions on the property. | Land | Improvement |
|---|---|---|---|---|
| 2025 | $6,683 | $75,035 | $7,081 | $67,954 |
| 2024 | $6,683 | $74,369 | $7,081 | $67,288 |
| 2023 | $6,452 | $73,221 | $7,081 | $66,140 |
| 2022 | $5,380 | $74,236 | $7,081 | $67,155 |
| 2021 | $6,162 | $70,259 | $7,081 | $63,178 |
| 2020 | $5,051 | $77,812 | $7,081 | $70,731 |
| 2019 | $4,547 | $76,065 | $7,081 | $68,984 |
| 2018 | $4,997 | $75,251 | $7,081 | $68,170 |
| 2017 | $5,541 | $57,642 | $7,081 | $50,561 |
| 2016 | $5,343 | $56,048 | $7,080 | $48,968 |
| 2015 | $3,012 | $41,921 | $7,081 | $34,840 |
| 2014 | $3,012 | $46,560 | $7,081 | $39,479 |
Source: Public Records
Map
Nearby Homes
- 309 E 108th St Unit 4E
- 309 E 108th St Unit 5C
- 309 E 108th St Unit 2B
- 305 E 108th St Unit 4 B
- 333 E 109th St Unit 7A
- 2047 2nd Ave
- 2132 2nd Ave Unit 4C
- 342 E 110th St Unit 8A
- 319 E 105th St Unit 6A
- 319 E 105th St Unit 4D
- 319 E 105th St Unit 6B
- 324 E 112th St Unit 6A
- 2049 2nd Ave
- 353 E 104th St Unit PH2
- 353 E 104th St Unit 7B
- 353 E 104th St Unit 9C
- 161 E 110th St Unit 8G
- 159 E 107th St
- 168 E 111th St Unit 3B
- 168 E 111th St Unit 3D
- 309 E 108th St Unit 1E
- 309 E 108th St Unit 5H
- 309 E 108th St Unit 5G
- 309 E 108th St Unit 5F
- 309 E 108th St Unit 5E
- 309 E 108th St Unit 5D
- 309 E 108th St Unit 5B
- 309 E 108th St Unit 5A
- 309 E 108th St Unit 4H
- 309 E 108th St Unit 4G
- 309 E 108th St Unit 4F
- 309 E 108th St Unit 4D
- 309 E 108th St Unit 4C
- 309 E 108th St Unit 4B
- 309 E 108th St Unit 4A
- 309 E 108th St Unit 3H
- 309 E 108th St Unit 3G
- 309 E 108th St Unit 3E
- 309 E 108th St Unit 3D
- 309 E 108th St Unit 3C
Your Personal Tour Guide
Ask me questions while you tour the home.