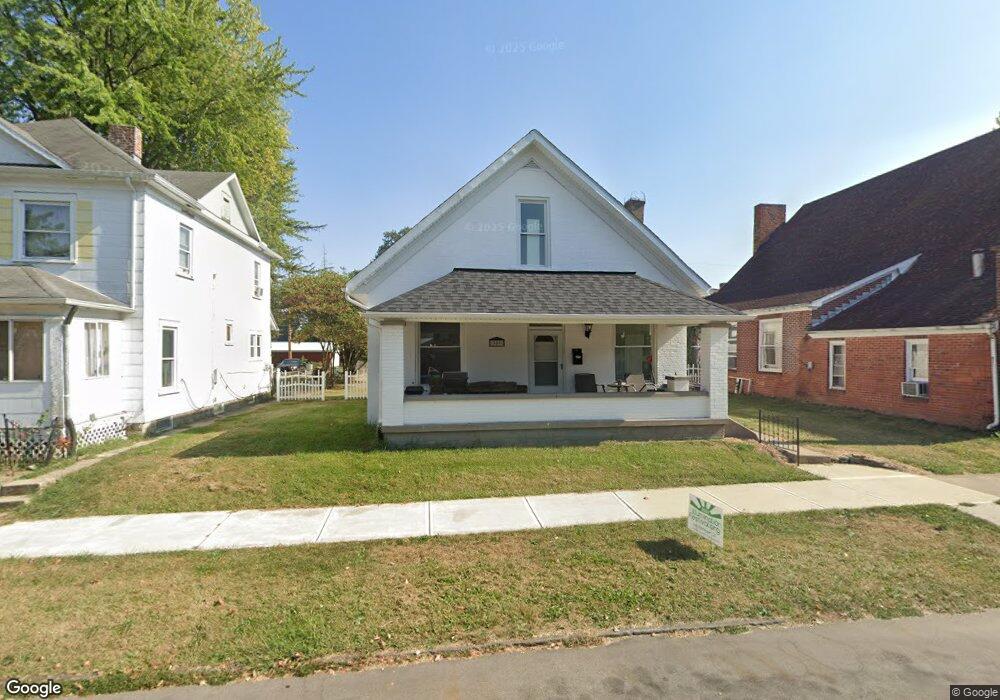
309 E 4th St Greenville, OH 45331
Estimated Value: $110,484 - $125,000
3
Beds
1
Bath
1,139
Sq Ft
$103/Sq Ft
Est. Value
About This Home
This home is located at 309 E 4th St, Greenville, OH 45331 and is currently estimated at $117,121, approximately $102 per square foot. 309 E 4th St is a home located in Darke County with nearby schools including Greenville Middle School, Greenville Intermediate School, and Greenville Primary School.
Ownership History
Date
Name
Owned For
Owner Type
Purchase Details
Closed on
Oct 13, 2015
Sold by
Fifth Third Mortgage Company
Bought by
Stastny Scott and Stastny Brandy L
Current Estimated Value
Purchase Details
Closed on
Apr 15, 2015
Sold by
Nilsen David A and Nielsen Lyndie B
Bought by
Fifith Third Mortgage Company
Purchase Details
Closed on
Feb 28, 2006
Sold by
Staley Charlotte A
Bought by
Nilsen David A and Nilsen Lyndie B
Home Financials for this Owner
Home Financials are based on the most recent Mortgage that was taken out on this home.
Original Mortgage
$87,000
Interest Rate
6.2%
Mortgage Type
Purchase Money Mortgage
Purchase Details
Closed on
Aug 20, 1999
Sold by
Grote Gladys
Bought by
Staley Charlotte A
Home Financials for this Owner
Home Financials are based on the most recent Mortgage that was taken out on this home.
Original Mortgage
$25,000
Interest Rate
7.7%
Mortgage Type
New Conventional
Create a Home Valuation Report for This Property
The Home Valuation Report is an in-depth analysis detailing your home's value as well as a comparison with similar homes in the area
Home Values in the Area
Average Home Value in this Area
Purchase History
We collect this data history from publicly available records. To have your information removed, we recommend requesting removal directly through your county’s website.
| Date | Buyer | Sale Price | Title Company |
|---|---|---|---|
| Stastny Scott | $39,000 | Servicelink | |
| Fifith Third Mortgage Company | $33,334 | Attorney | |
| Nilsen David A | $87,000 | None Available | |
| Staley Charlotte A | $45,900 | -- |
Source: Public Records
Mortgage History
We collect this data history from publicly available records. To have your information removed, we recommend requesting removal directly through your county’s website.
| Date | Status | Borrower | Loan Amount |
|---|---|---|---|
| Previous Owner | Nilsen David A | $87,000 | |
| Previous Owner | Staley Charlotte A | $25,000 |
Source: Public Records
Tax History
| Year | Tax Paid | Tax Assessment Tax Assessment Total Assessment is a certain percentage of the fair market value that is determined by local assessors to be the total taxable value of land and additions on the property. | Land | Improvement |
|---|---|---|---|---|
| 2025 | $1,111 | $30,600 | $5,890 | $24,710 |
| 2024 | $1,111 | $30,600 | $5,890 | $24,710 |
| 2023 | $1,110 | $30,600 | $5,890 | $24,710 |
| 2022 | $650 | $16,280 | $4,920 | $11,360 |
| 2021 | $653 | $16,280 | $4,920 | $11,360 |
| 2020 | $654 | $16,280 | $4,920 | $11,360 |
| 2019 | $369 | $9,100 | $4,920 | $4,180 |
| 2018 | $372 | $9,100 | $4,920 | $4,180 |
| 2017 | $377 | $9,100 | $4,920 | $4,180 |
| 2016 | $368 | $9,100 | $4,860 | $4,240 |
| 2015 | $712 | $17,610 | $4,890 | $12,720 |
| 2014 | $713 | $17,610 | $4,890 | $12,720 |
| 2013 | $777 | $19,020 | $4,890 | $14,130 |
Source: Public Records
Map
Nearby Homes
Your Personal Tour Guide
Ask me questions while you tour the home.