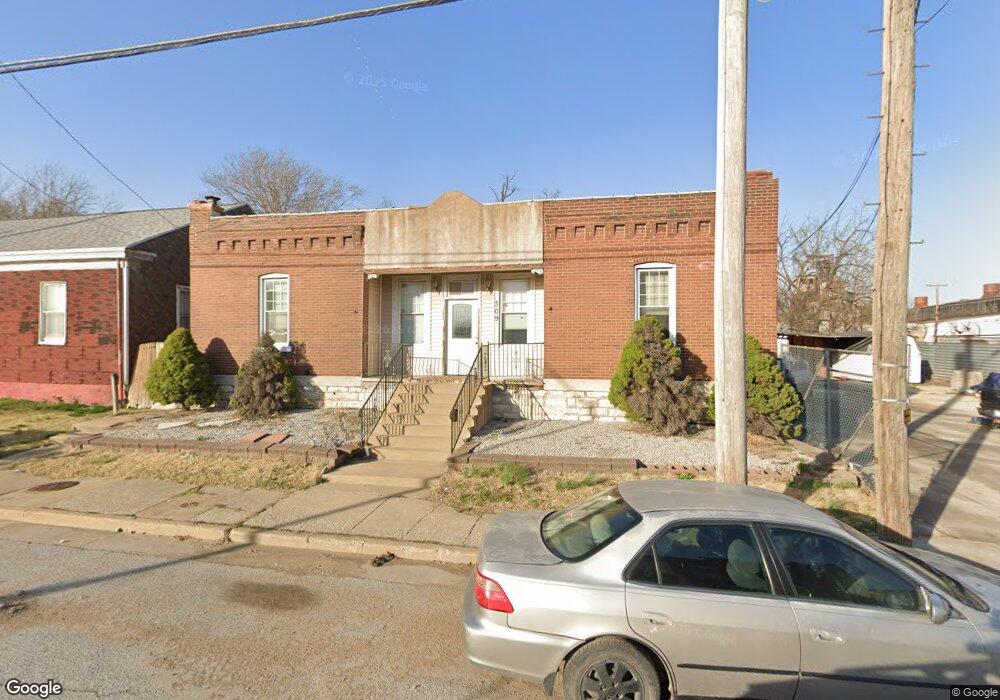
309 E Courtois St Saint Louis, MO 63111
Patch NeighborhoodEstimated Value: $97,000 - $113,000
--
Bed
1
Bath
3,048
Sq Ft
$34/Sq Ft
Est. Value
About This Home
This home is located at 309 E Courtois St, Saint Louis, MO 63111 and is currently estimated at $105,127, approximately $34 per square foot. 309 E Courtois St is a home located in St. Louis City with nearby schools including Lyon at Blow Elementary School, Woerner Elementary School, and Roosevelt High School.
Ownership History
Date
Name
Owned For
Owner Type
Purchase Details
Closed on
Jan 13, 2012
Sold by
Gateway Bank Of St Louis
Bought by
Sweeney Darline
Current Estimated Value
Purchase Details
Closed on
Jun 23, 2011
Sold by
Hemm Paula
Bought by
Gateway Bank Of St Louis and Central Bank Of St Louis
Purchase Details
Closed on
Nov 26, 2007
Sold by
Vushaj Alberto
Bought by
Hemm Paula
Purchase Details
Closed on
Jul 7, 2004
Sold by
Cyrus Development Llc
Bought by
Vushaj Alberto
Purchase Details
Closed on
Apr 20, 2004
Sold by
Wachovia Bank Of Delaware Na
Bought by
Cyrus Development Llc
Purchase Details
Closed on
Feb 1, 2000
Sold by
Echlin Dorothy
Bought by
Wolfenbarker Janet and Echlin Dorothy
Home Financials for this Owner
Home Financials are based on the most recent Mortgage that was taken out on this home.
Original Mortgage
$55,000
Interest Rate
8.16%
Mortgage Type
Purchase Money Mortgage
Create a Home Valuation Report for This Property
The Home Valuation Report is an in-depth analysis detailing your home's value as well as a comparison with similar homes in the area
Home Values in the Area
Average Home Value in this Area
Purchase History
| Date | Buyer | Sale Price | Title Company |
|---|---|---|---|
| Sweeney Darline | -- | None Available | |
| Gateway Bank Of St Louis | $35,000 | None Available | |
| Hemm Paula | -- | None Available | |
| Vushaj Alberto | -- | Phoenix Title | |
| Cyrus Development Llc | -- | -- | |
| Wolfenbarker Janet | -- | -- |
Source: Public Records
Mortgage History
| Date | Status | Borrower | Loan Amount |
|---|---|---|---|
| Previous Owner | Wolfenbarker Janet | $55,000 |
Source: Public Records
Tax History Compared to Growth
Tax History
| Year | Tax Paid | Tax Assessment Tax Assessment Total Assessment is a certain percentage of the fair market value that is determined by local assessors to be the total taxable value of land and additions on the property. | Land | Improvement |
|---|---|---|---|---|
| 2025 | $444 | $6,250 | $1,670 | $4,580 |
| 2024 | $424 | $4,970 | $1,670 | $3,300 |
| 2023 | $424 | $4,970 | $1,670 | $3,300 |
| 2022 | $412 | $4,640 | $1,670 | $2,970 |
| 2021 | $411 | $4,640 | $1,670 | $2,970 |
| 2020 | $394 | $4,470 | $1,670 | $2,800 |
| 2019 | $393 | $4,460 | $1,670 | $2,790 |
| 2018 | $350 | $3,820 | $1,670 | $2,150 |
| 2017 | $344 | $3,820 | $1,670 | $2,150 |
| 2016 | $348 | $3,820 | $1,670 | $2,150 |
| 2015 | $318 | $3,820 | $1,670 | $2,150 |
| 2014 | $312 | $3,820 | $1,670 | $2,150 |
| 2013 | -- | $3,740 | $1,670 | $2,070 |
Source: Public Records
Map
Nearby Homes
- 7914 S Broadway
- 120 W Courtois St
- 7915 S Broadway
- 214 W Steins St
- 7413 S Broadway
- 7505 Pennsylvania Ave
- 7514 Minnesota Ave
- 7326 Pennsylvania Ave
- 7708 Michigan Ave
- 7700 Michigan Ave
- 8213 S Broadway
- 7301 Pennsylvania Ave
- 7220 Pennsylvania Ave
- 7310 Minnesota Ave
- 7227 Pennsylvania Ave
- 7617 Ivory Ave
- 7621 Virginia Ave
- 8418 -20 S Broadway
- 8309 Minnesota Ave
- 324 Hurck St
- 7718 Vulcan St
- 301 E Courtois St
- 310 E Courtois St
- 308 E Courtois St
- 300 E Courtois St
- 7709 Vulcan St
- 314 E Courtois St
- 7725 Vulcan St
- 7721 Vulcan St
- 7717 Vulcan St
- 226 E Schirmer St
- 216 E Schirmer St
- 7819 Reilly Ave
- 311 E Primm St
- 7827 Reilly Ave
- 7730 Water St
- 7718 Water St
- 7714 Water 18-20 St
- 7714 Water St
- 219 E Schirmer St