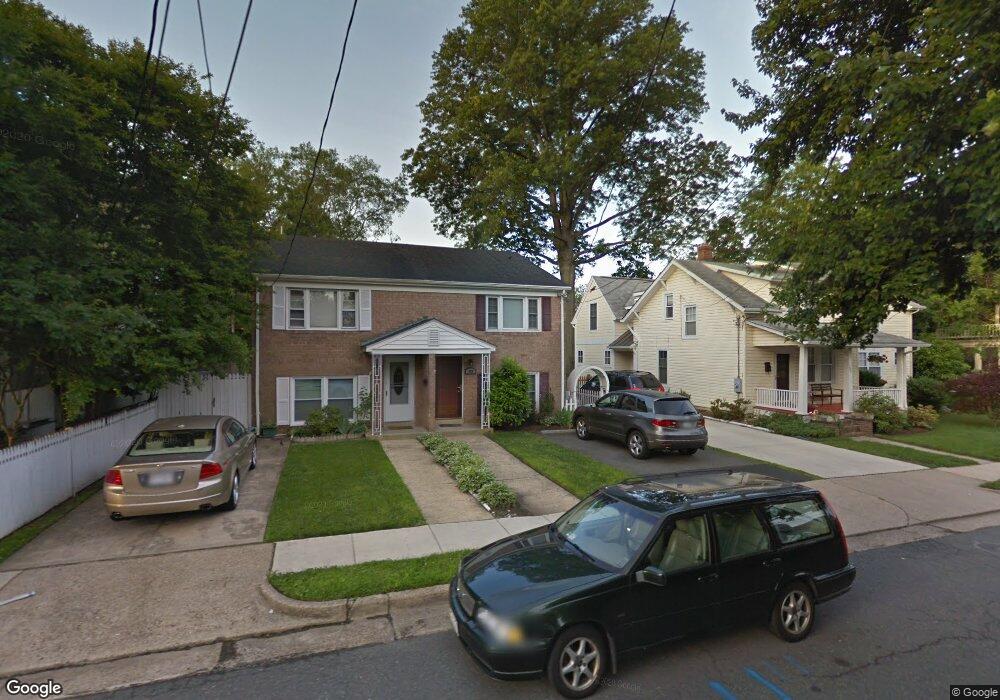
309 E Howell Ave Unit A Alexandria, VA 22301
Del Ray NeighborhoodEstimated Value: $819,000 - $872,000
--
Bed
2
Baths
1,471
Sq Ft
$576/Sq Ft
Est. Value
About This Home
This home is located at 309 E Howell Ave Unit A, Alexandria, VA 22301 and is currently estimated at $848,031, approximately $576 per square foot. 309 E Howell Ave Unit A is a home located in Alexandria City with nearby schools including Mount Vernon Community School, George Washington Middle School, and Alexandria City High School.
Ownership History
Date
Name
Owned For
Owner Type
Purchase Details
Closed on
Sep 19, 2012
Sold by
Jackson Rinaldo
Bought by
Liebowitz Rebecca
Current Estimated Value
Home Financials for this Owner
Home Financials are based on the most recent Mortgage that was taken out on this home.
Original Mortgage
$352,000
Outstanding Balance
$243,799
Interest Rate
3.59%
Mortgage Type
New Conventional
Estimated Equity
$604,232
Create a Home Valuation Report for This Property
The Home Valuation Report is an in-depth analysis detailing your home's value as well as a comparison with similar homes in the area
Home Values in the Area
Average Home Value in this Area
Purchase History
| Date | Buyer | Sale Price | Title Company |
|---|---|---|---|
| Liebowitz Rebecca | $440,000 | -- |
Source: Public Records
Mortgage History
| Date | Status | Borrower | Loan Amount |
|---|---|---|---|
| Open | Liebowitz Rebecca | $352,000 |
Source: Public Records
Tax History Compared to Growth
Tax History
| Year | Tax Paid | Tax Assessment Tax Assessment Total Assessment is a certain percentage of the fair market value that is determined by local assessors to be the total taxable value of land and additions on the property. | Land | Improvement |
|---|---|---|---|---|
| 2025 | $9,445 | $776,419 | $473,882 | $302,537 |
| 2024 | $9,445 | $776,419 | $473,882 | $302,537 |
| 2023 | $8,618 | $776,419 | $473,882 | $302,537 |
| 2022 | $8,368 | $753,853 | $451,316 | $302,537 |
| 2021 | $7,579 | $682,811 | $382,471 | $300,340 |
| 2020 | $7,777 | $664,442 | $364,102 | $300,340 |
| 2019 | $7,105 | $628,787 | $324,740 | $304,047 |
| 2018 | $7,105 | $628,787 | $324,740 | $304,047 |
| 2017 | $6,812 | $602,849 | $300,685 | $302,164 |
| 2016 | $6,176 | $575,601 | $284,284 | $291,317 |
| 2015 | $5,816 | $557,662 | $266,345 | $291,317 |
| 2014 | $5,917 | $567,344 | $242,131 | $325,213 |
Source: Public Records
Map
Nearby Homes
- 1706 Dewitt Ave Unit A
- 307 E Oxford Ave Unit 1/2
- 1908 Mount Vernon Ave
- 2100 Mount Vernon Ave
- 510 E Bellefonte Ave Unit A
- 508 E Custis Ave Unit A
- 1800 Mount Vernon Ave Unit 207
- 100 E Custis Ave
- 1740 Price St
- 2007 Richmond Hwy Unit 101
- 1907 Richmond Hwy Unit 101
- 24 E Bellefonte Ave
- 2215 Richmond Hwy Unit 101
- 1901 Main Line Blvd Unit 102
- 1907 Main Line Blvd Unit 101
- 710 Diamond Ave
- Bryce Plan at Del Ray Corner At Oakville
- Flynn Plan at Del Ray Corner At Oakville
- Huntly Plan at Del Ray Corner At Oakville
- 304 E Nelson Ave
- 309 E Howell Ave
- 307 E Howell Ave
- 313 E Howell Ave
- 305 E Howell Ave
- 308 E Bellefonte Ave
- 306 E Bellefonte Ave
- 310 E Bellefonte Ave
- 310 E Bellefonte Ave Unit A
- 308 E Howell Ave
- 312 E Howell Ave
- 310 E Howell Ave
- 304 E Bellefonte Ave
- 303 E Howell Ave
- 312 E Bellefonte Ave
- 306 E Howell Ave
- 314 E Howell Ave
- 302 E Bellefonte Ave
- 304 E Howell Ave
- 317 E Howell Ave
- 301 E Howell Ave