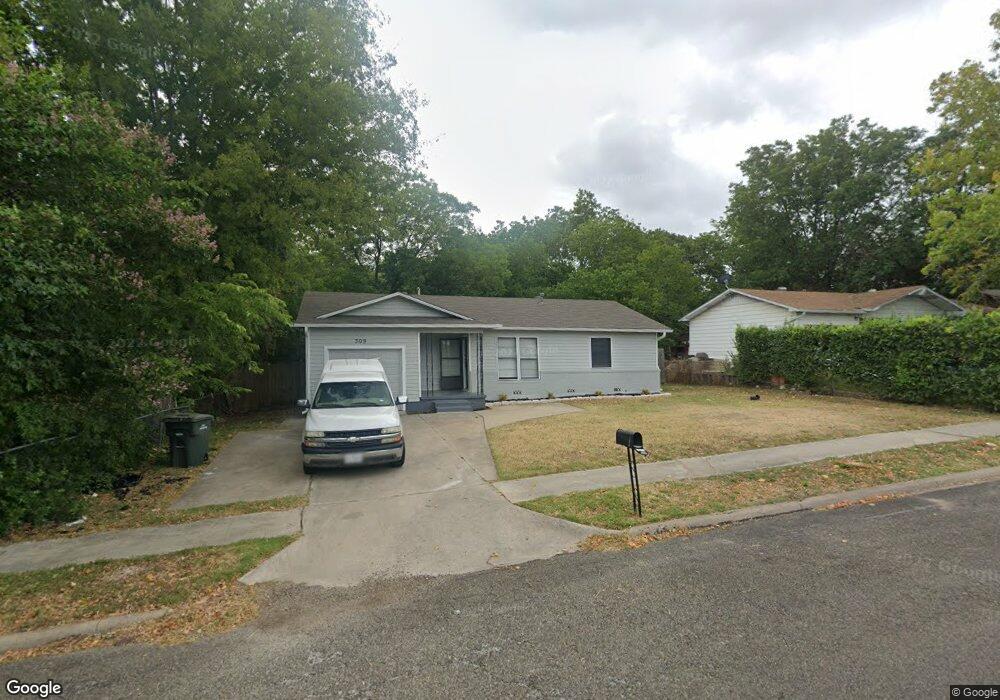
309 Elms Copperas Cove, TX 76522
Estimated Value: $126,389 - $128,000
3
Beds
1
Bath
1,071
Sq Ft
$119/Sq Ft
Est. Value
About This Home
This home is located at 309 Elms, Copperas Cove, TX 76522 and is currently estimated at $127,195, approximately $118 per square foot. 309 Elms is a home located in Coryell County with nearby schools including C.R. Clements/Hollie Parsons Elementary School, Copperas Cove Junior High School, and Copperas Cove High School.
Ownership History
Date
Name
Owned For
Owner Type
Purchase Details
Closed on
Jul 9, 2025
Sold by
Nationstar Mortgage Llc
Bought by
Secretary Of Veterans Affairs
Current Estimated Value
Purchase Details
Closed on
Jun 3, 2025
Sold by
Stockman Donna
Bought by
Nationstar Mortgage Llc
Purchase Details
Closed on
Aug 12, 2022
Sold by
Lhcs Llc
Bought by
Henley Toy and Henley Erin
Home Financials for this Owner
Home Financials are based on the most recent Mortgage that was taken out on this home.
Original Mortgage
$170,841
Interest Rate
5.3%
Mortgage Type
VA
Purchase Details
Closed on
Jun 2, 2015
Sold by
Mcdowell Rena and Mcdowell Shawn
Bought by
Lhcs Llc
Purchase Details
Closed on
Aug 6, 2007
Sold by
Easterling James S and Easterling Nanacy M
Bought by
Mcdowell Shawn and Mcdowell Rena
Home Financials for this Owner
Home Financials are based on the most recent Mortgage that was taken out on this home.
Original Mortgage
$51,000
Interest Rate
6.69%
Create a Home Valuation Report for This Property
The Home Valuation Report is an in-depth analysis detailing your home's value as well as a comparison with similar homes in the area
Home Values in the Area
Average Home Value in this Area
Purchase History
| Date | Buyer | Sale Price | Title Company |
|---|---|---|---|
| Secretary Of Veterans Affairs | -- | None Listed On Document | |
| Nationstar Mortgage Llc | $100,020 | None Listed On Document | |
| Henley Toy | -- | -- | |
| Lhcs Llc | $9,980 | None Available | |
| Mcdowell Shawn | -- | -- |
Source: Public Records
Mortgage History
| Date | Status | Borrower | Loan Amount |
|---|---|---|---|
| Previous Owner | Henley Toy | $170,841 | |
| Previous Owner | Mcdowell Shawn | $51,000 |
Source: Public Records
Tax History Compared to Growth
Tax History
| Year | Tax Paid | Tax Assessment Tax Assessment Total Assessment is a certain percentage of the fair market value that is determined by local assessors to be the total taxable value of land and additions on the property. | Land | Improvement |
|---|---|---|---|---|
| 2025 | $3,038 | $148,800 | $15,000 | $133,800 |
| 2024 | $3,038 | $153,340 | $15,000 | $138,340 |
| 2023 | $3,038 | $149,170 | $15,000 | $134,170 |
| 2022 | $1,683 | $75,000 | $12,000 | $63,000 |
| 2021 | $1,277 | $49,547 | $10,000 | $39,547 |
| 2020 | $1,194 | $45,604 | $10,000 | $35,604 |
| 2019 | $1,422 | $52,457 | $10,000 | $42,457 |
| 2018 | $1,445 | $53,250 | $10,000 | $43,250 |
| 2017 | $1,197 | $45,000 | $10,000 | $35,000 |
| 2016 | $1,330 | $50,000 | $10,000 | $40,000 |
| 2015 | $1,210 | $55,600 | $10,000 | $45,600 |
| 2014 | $1,210 | $54,780 | $10,000 | $44,780 |
Source: Public Records
Map
Nearby Homes