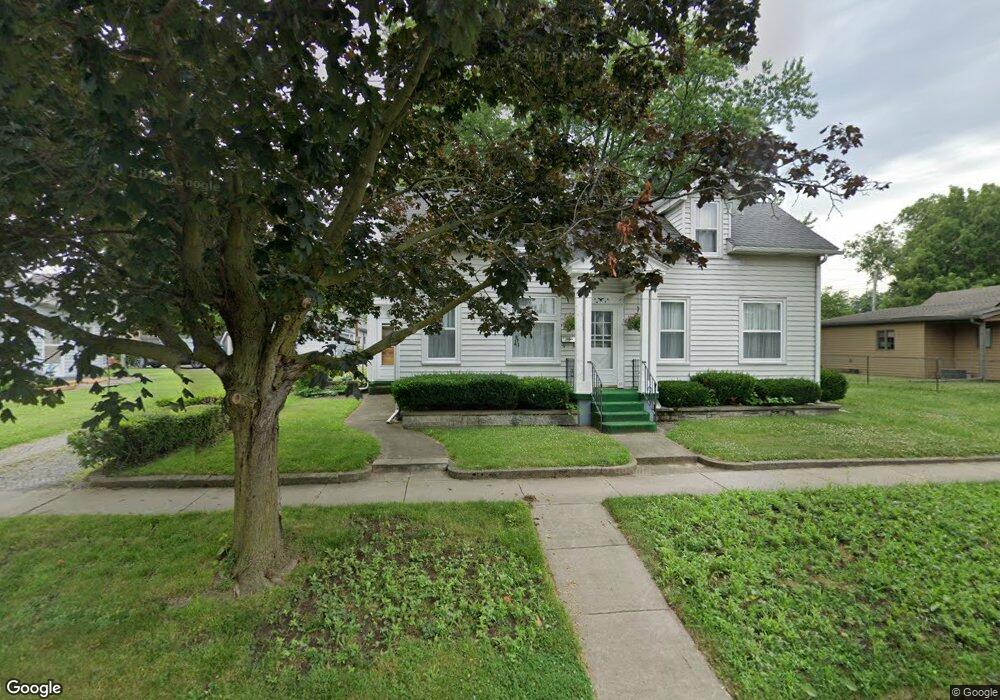
309 I St La Porte, IN 46350
Estimated Value: $105,000 - $237,000
3
Beds
1
Bath
1,560
Sq Ft
$119/Sq Ft
Est. Value
About This Home
This home is located at 309 I St, La Porte, IN 46350 and is currently estimated at $186,243, approximately $119 per square foot. 309 I St is a home located in LaPorte County with nearby schools including La Porte High School, Handley Elementary School, and Kesling Intermediate School.
Ownership History
Date
Name
Owned For
Owner Type
Purchase Details
Closed on
Dec 15, 2021
Sold by
Kimmel Richard D and Kimmel Felicia H
Bought by
Roberts Scott A
Current Estimated Value
Home Financials for this Owner
Home Financials are based on the most recent Mortgage that was taken out on this home.
Original Mortgage
$69,825
Outstanding Balance
$64,203
Interest Rate
3.09%
Mortgage Type
New Conventional
Estimated Equity
$122,040
Purchase Details
Closed on
Mar 28, 2011
Sold by
Roberts Vicki L and Kimmel Wayne A
Bought by
Kimmel Richard D and Kimmel Felicia H
Create a Home Valuation Report for This Property
The Home Valuation Report is an in-depth analysis detailing your home's value as well as a comparison with similar homes in the area
Home Values in the Area
Average Home Value in this Area
Purchase History
| Date | Buyer | Sale Price | Title Company |
|---|---|---|---|
| Roberts Scott A | -- | None Available | |
| Kimmel Richard D | -- | Fidelity National Title |
Source: Public Records
Mortgage History
| Date | Status | Borrower | Loan Amount |
|---|---|---|---|
| Open | Roberts Scott A | $69,825 |
Source: Public Records
Tax History Compared to Growth
Tax History
| Year | Tax Paid | Tax Assessment Tax Assessment Total Assessment is a certain percentage of the fair market value that is determined by local assessors to be the total taxable value of land and additions on the property. | Land | Improvement |
|---|---|---|---|---|
| 2024 | $1,396 | $144,500 | $18,700 | $125,800 |
| 2022 | $1,124 | $119,400 | $15,600 | $103,800 |
| 2021 | $1,124 | $112,400 | $15,600 | $96,800 |
| 2020 | $1,074 | $112,400 | $15,600 | $96,800 |
| 2019 | $1,122 | $107,400 | $18,700 | $88,700 |
| 2018 | $1,029 | $98,100 | $16,500 | $81,600 |
| 2017 | $978 | $30,000 | $5,300 | $24,700 |
| 2016 | $1,944 | $94,800 | $16,100 | $78,700 |
| 2014 | $1,742 | $87,100 | $16,100 | $71,000 |
Source: Public Records
Map
Nearby Homes
- 1010 2nd St
- 404 F St
- 508 F St
- 305 F St
- 607 J St
- 117 Patton St
- 1401 Jefferson Ave
- 513 1st St
- 411 E St
- N SR State Road 39
- V/l State Road 39
- VL State Road 39
- 000 State Road 39
- 602 D St
- 809 Chicago St
- 305 C St
- 0 N State Road 39 Unit 202541633
- 0 N State Road 39 Unit 202541606
- 502 A St
- 0 1st St Unit NRA542339