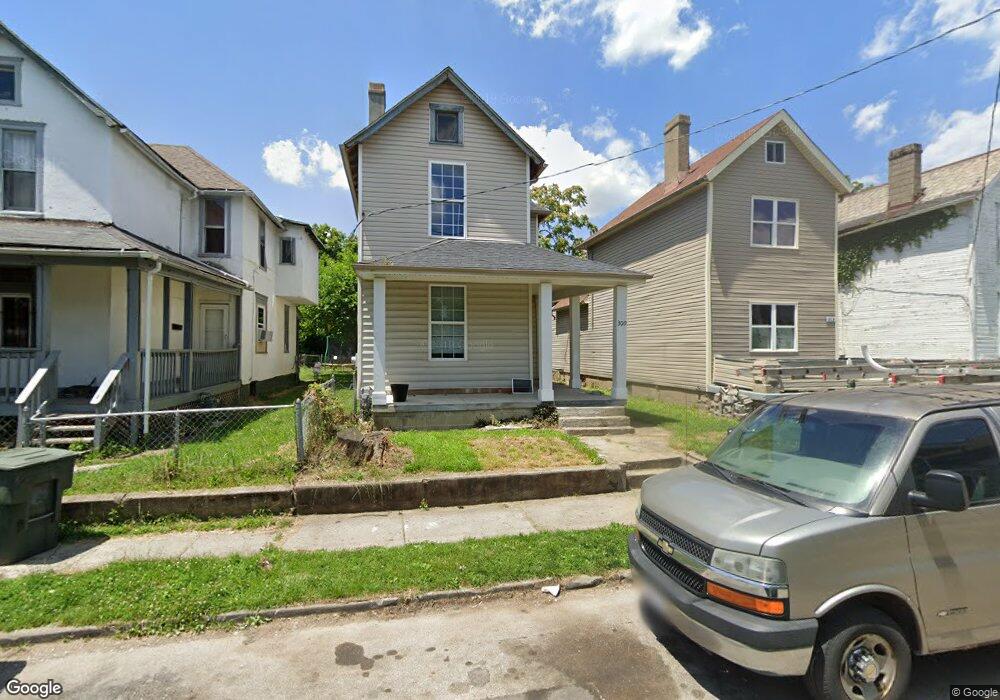
309 Johnson St Columbus, OH 43203
King-Lincoln Bronzeville NeighborhoodEstimated Value: $173,084 - $224,000
3
Beds
1
Bath
1,436
Sq Ft
$142/Sq Ft
Est. Value
About This Home
This home is located at 309 Johnson St, Columbus, OH 43203 and is currently estimated at $203,771, approximately $141 per square foot. 309 Johnson St is a home located in Franklin County with nearby schools including Eastgate Elementary School, Champion Middle School, and East High School.
Ownership History
Date
Name
Owned For
Owner Type
Purchase Details
Closed on
Sep 10, 2019
Sold by
Hopkins Shanly
Bought by
Srh Property Investments Llc
Current Estimated Value
Purchase Details
Closed on
Jul 9, 2018
Sold by
Hopkins William G
Bought by
Hopkins Shanly
Purchase Details
Closed on
Dec 11, 2012
Sold by
The City Of Columbus
Bought by
Hopkins William G
Purchase Details
Closed on
Mar 12, 2012
Sold by
Smith Roger
Bought by
City Of Columbus
Purchase Details
Closed on
Mar 21, 2000
Sold by
Jo Patterson Hubert W and Jo Mary
Bought by
Smith Roger
Home Financials for this Owner
Home Financials are based on the most recent Mortgage that was taken out on this home.
Original Mortgage
$47,625
Interest Rate
11.25%
Purchase Details
Closed on
Dec 4, 1996
Sold by
Segal Necker Investment
Bought by
Hubert W Patterson
Home Financials for this Owner
Home Financials are based on the most recent Mortgage that was taken out on this home.
Original Mortgage
$15,000
Interest Rate
7.91%
Mortgage Type
New Conventional
Purchase Details
Closed on
Sep 1, 1983
Create a Home Valuation Report for This Property
The Home Valuation Report is an in-depth analysis detailing your home's value as well as a comparison with similar homes in the area
Home Values in the Area
Average Home Value in this Area
Purchase History
| Date | Buyer | Sale Price | Title Company |
|---|---|---|---|
| Srh Property Investments Llc | -- | None Available | |
| Hopkins Shanly | -- | None Available | |
| Hopkins William G | -- | None Available | |
| City Of Columbus | $12,898 | Attorney | |
| Smith Roger | $63,500 | Capcity Title | |
| Hubert W Patterson | $15,000 | -- | |
| -- | $25,500 | -- |
Source: Public Records
Mortgage History
| Date | Status | Borrower | Loan Amount |
|---|---|---|---|
| Previous Owner | Smith Roger | $47,625 | |
| Previous Owner | Hubert W Patterson | $15,000 |
Source: Public Records
Tax History
| Year | Tax Paid | Tax Assessment Tax Assessment Total Assessment is a certain percentage of the fair market value that is determined by local assessors to be the total taxable value of land and additions on the property. | Land | Improvement |
|---|---|---|---|---|
| 2025 | $2,473 | $39,310 | $17,570 | $21,740 |
| 2024 | $2,473 | $51,030 | $17,570 | $33,460 |
| 2023 | $2,309 | $51,030 | $17,570 | $33,460 |
| 2022 | $342 | $6,440 | $2,240 | $4,200 |
| 2021 | $343 | $6,440 | $2,240 | $4,200 |
| 2020 | $424 | $6,440 | $2,240 | $4,200 |
| 2019 | $348 | $5,600 | $1,960 | $3,640 |
| 2018 | $782 | $5,600 | $1,960 | $3,640 |
| 2017 | $670 | $10,780 | $1,960 | $8,820 |
| 2016 | $773 | $10,610 | $1,750 | $8,860 |
| 2015 | $463 | $10,610 | $1,750 | $8,860 |
| 2014 | $502 | $8,090 | $1,750 | $6,340 |
| 2013 | $34 | $8,505 | $1,855 | $6,650 |
Source: Public Records
Map
Nearby Homes
- 317 Johnson St
- 304 Johnson St
- 1440 Mount Vernon Ave
- 280 Taylor Ave
- 1474 Hildreth Ave
- 1500 Harvard Ave
- 1575 Granville St
- 1418 Phale D Hale Dr
- 431 Johnson St
- 1439 Atcheson St
- 1458 Harvard Ave
- 0 Harvard Ave
- 1401 Atcheson St
- 1577 Richmond Ave
- 1523 Rosethorne Ave
- 1623 Granville St
- 1634-1636 Greenway Ave
- 0 Bassett Ave
- 1319 Hildreth Ave Unit 323
- 214 Parkwood Ave
- 313 Johnson St Unit 2184D
- 305 Johnson St
- 301 Johnson St
- 321 Johnson St
- 297 Johnson St
- 318 Burt St
- 293 Johnson St
- 322 Burt St
- 320 Johnson St Unit 320
- 310 Burt St
- 306 Burt St
- 308 Johnson St
- 312 Johnson St
- 302 Burt St
- 316 Johnson St
- 1479 Mount Vernon Ave Unit 481
- 300 Johnson St
- 1473 Mount Vernon Ave
- 296 Johnson St
- 298 Burt St
Your Personal Tour Guide
Ask me questions while you tour the home.