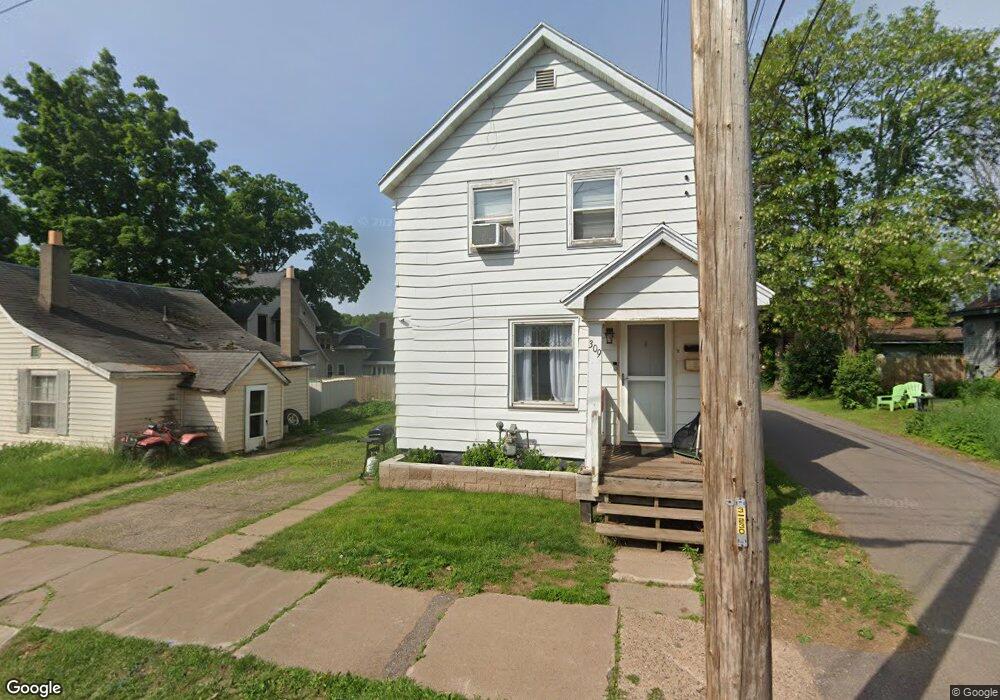
309 Kanter St Unit 5 Negaunee, MI 49866
Estimated Value: $141,231 - $146,000
3
Beds
1
Bath
1,282
Sq Ft
$112/Sq Ft
Est. Value
About This Home
This home is located at 309 Kanter St Unit 5, Negaunee, MI 49866 and is currently estimated at $143,077, approximately $111 per square foot. 309 Kanter St Unit 5 is a home located in Marquette County with nearby schools including Lakeview Elementary School, Negaunee Middle School, and Negaunee High School.
Ownership History
Date
Name
Owned For
Owner Type
Purchase Details
Closed on
Nov 4, 2025
Sold by
Bennett Travis
Bought by
Iron Town Capital Investments Llc
Current Estimated Value
Home Financials for this Owner
Home Financials are based on the most recent Mortgage that was taken out on this home.
Original Mortgage
$150,000
Outstanding Balance
$150,000
Interest Rate
6.26%
Mortgage Type
New Conventional
Estimated Equity
-$6,923
Purchase Details
Closed on
Dec 17, 2024
Sold by
Cox Douglas Paul
Bought by
Bennett Travis
Create a Home Valuation Report for This Property
The Home Valuation Report is an in-depth analysis detailing your home's value as well as a comparison with similar homes in the area
Home Values in the Area
Average Home Value in this Area
Purchase History
| Date | Buyer | Sale Price | Title Company |
|---|---|---|---|
| Iron Town Capital Investments Llc | -- | None Listed On Document | |
| Bennett Travis | $20,000 | Keweenaw Title Agency | |
| Bennett Travis | $20,000 | Keweenaw Title Agency |
Source: Public Records
Mortgage History
| Date | Status | Borrower | Loan Amount |
|---|---|---|---|
| Open | Iron Town Capital Investments Llc | $150,000 |
Source: Public Records
Tax History Compared to Growth
Tax History
| Year | Tax Paid | Tax Assessment Tax Assessment Total Assessment is a certain percentage of the fair market value that is determined by local assessors to be the total taxable value of land and additions on the property. | Land | Improvement |
|---|---|---|---|---|
| 2025 | $1,145 | $47,650 | $0 | $0 |
| 2024 | $7 | $40,350 | $0 | $0 |
| 2023 | $669 | $37,600 | $0 | $0 |
| 2022 | $1,015 | $28,450 | $0 | $0 |
| 2021 | $985 | $30,300 | $0 | $0 |
| 2020 | $962 | $28,450 | $0 | $0 |
| 2019 | $944 | $27,100 | $0 | $0 |
| 2018 | $929 | $24,550 | $0 | $0 |
| 2017 | $913 | $22,400 | $0 | $0 |
| 2016 | $900 | $21,100 | $0 | $0 |
| 2015 | -- | $21,100 | $0 | $0 |
| 2014 | -- | $19,350 | $0 | $0 |
| 2012 | -- | $17,350 | $0 | $0 |
Source: Public Records
Map
Nearby Homes