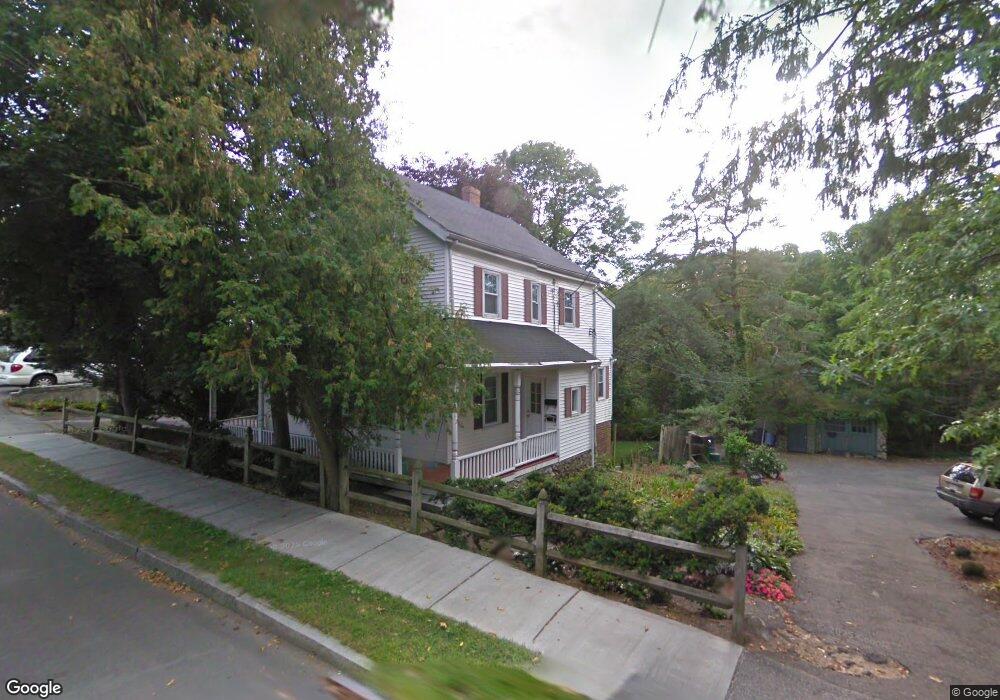
309 Langley Rd Newton Center, MA 02459
Thompsonville NeighborhoodEstimated Value: $1,061,000 - $1,528,000
3
Beds
3
Baths
2,191
Sq Ft
$612/Sq Ft
Est. Value
About This Home
This home is located at 309 Langley Rd, Newton Center, MA 02459 and is currently estimated at $1,340,333, approximately $611 per square foot. 309 Langley Rd is a home located in Middlesex County with nearby schools including Bowen School, Oak Hill Middle School, and Newton South High School.
Ownership History
Date
Name
Owned For
Owner Type
Purchase Details
Closed on
May 29, 2018
Sold by
Allison Michael P and Allison Anne N
Bought by
Allison Ret
Current Estimated Value
Create a Home Valuation Report for This Property
The Home Valuation Report is an in-depth analysis detailing your home's value as well as a comparison with similar homes in the area
Home Values in the Area
Average Home Value in this Area
Purchase History
| Date | Buyer | Sale Price | Title Company |
|---|---|---|---|
| Allison Ret | -- | -- |
Source: Public Records
Tax History Compared to Growth
Tax History
| Year | Tax Paid | Tax Assessment Tax Assessment Total Assessment is a certain percentage of the fair market value that is determined by local assessors to be the total taxable value of land and additions on the property. | Land | Improvement |
|---|---|---|---|---|
| 2025 | $12,565 | $1,282,100 | $891,500 | $390,600 |
| 2024 | $12,149 | $1,244,800 | $865,500 | $379,300 |
| 2023 | $11,382 | $1,118,100 | $692,200 | $425,900 |
| 2022 | $10,891 | $1,035,300 | $640,900 | $394,400 |
| 2021 | $10,220 | $949,800 | $588,000 | $361,800 |
| 2020 | $9,916 | $949,800 | $588,000 | $361,800 |
| 2019 | $9,276 | $887,700 | $549,500 | $338,200 |
| 2018 | $9,043 | $835,800 | $510,800 | $325,000 |
| 2017 | $8,527 | $766,800 | $468,600 | $298,200 |
| 2016 | $8,006 | $703,500 | $429,900 | $273,600 |
| 2015 | $7,634 | $657,500 | $401,800 | $255,700 |
Source: Public Records
Map
Nearby Homes
- 20 Hamlet St
- 20 Hamlet St Unit 1
- 42 Bow Rd
- 20 Bartlett Terrace
- 41-43 John Unit B
- 250 Hammond Pond Pkwy Unit 1604N
- 250 Hammond Pond Pkwy Unit 1002N
- 250 Hammond Pond Pkwy Unit 614S
- 250 Hammond Pond Pkwy Unit 603S
- 250 Hammond Pond Pkwy Unit 615N
- 250 Hammond Pond Pkwy Unit 306N
- 154 Langley Rd Unit 1
- 85 Dudley Rd
- 5 Halcyon Rd
- 9 Ripley St Unit 1
- 280 Boylston St Unit 203
- 280 Boylston St Unit 905
- 280 Boylston St Unit 710
- 280 Boylston St Unit 908
- 280 Boylston St Unit 415
- 309 Langley Rd Unit 1
- 315-317 Langley
- 315 Langley Rd
- 315 Langley Rd Unit 1
- 317 Langley Rd
- 317 Langley Rd Unit 1
- 274 Langley Rd Unit 274
- 306 Langley Rd
- 306 Langley Rd Unit 306
- 314 Langley Rd
- 314 Langley Rd Unit 1
- 314 Langley Rd Unit 2
- 323 Langley Rd Unit 325
- 323 Langley Rd Unit 2
- 325 Langley Rd
- 323 Langley Rd Unit 323
- 323 Langley Rd Unit 1
- 310 Langley Rd Unit 312
- 304 Langley Rd
- 6 Hamlet St