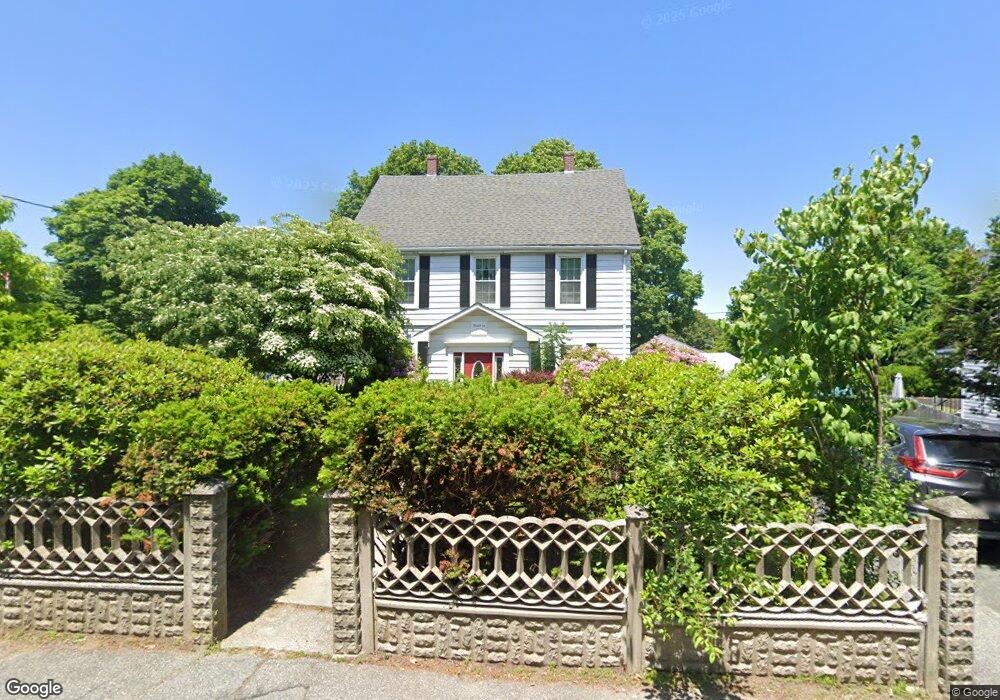
309 Lynnfield St Peabody, MA 01960
South Peabody NeighborhoodEstimated Value: $753,000 - $911,000
3
Beds
3
Baths
2,492
Sq Ft
$337/Sq Ft
Est. Value
About This Home
This home is located at 309 Lynnfield St, Peabody, MA 01960 and is currently estimated at $839,207, approximately $336 per square foot. 309 Lynnfield St is a home located in Essex County with nearby schools including Peabody Veterans Memorial High School and Our Lady Of Assumption School.
Ownership History
Date
Name
Owned For
Owner Type
Purchase Details
Closed on
Jul 30, 1991
Sold by
Broan Forman Corp
Bought by
Plassman Joseph F and Catherine Plassman
Current Estimated Value
Purchase Details
Closed on
Oct 12, 1990
Sold by
Silva Alfred F
Bought by
Brown Forman Corp
Create a Home Valuation Report for This Property
The Home Valuation Report is an in-depth analysis detailing your home's value as well as a comparison with similar homes in the area
Home Values in the Area
Average Home Value in this Area
Purchase History
| Date | Buyer | Sale Price | Title Company |
|---|---|---|---|
| Plassman Joseph F | $155,000 | -- | |
| Brown Forman Corp | $192,375 | -- |
Source: Public Records
Mortgage History
| Date | Status | Borrower | Loan Amount |
|---|---|---|---|
| Open | Brown Forman Corp | $15,000 | |
| Open | Brown Forman Corp | $160,000 |
Source: Public Records
Tax History Compared to Growth
Tax History
| Year | Tax Paid | Tax Assessment Tax Assessment Total Assessment is a certain percentage of the fair market value that is determined by local assessors to be the total taxable value of land and additions on the property. | Land | Improvement |
|---|---|---|---|---|
| 2025 | $6,229 | $672,700 | $222,100 | $450,600 |
| 2024 | $5,477 | $600,600 | $222,100 | $378,500 |
| 2023 | $4,798 | $504,000 | $198,300 | $305,700 |
| 2022 | $4,629 | $458,300 | $177,100 | $281,200 |
| 2021 | $4,344 | $414,100 | $161,000 | $253,100 |
| 2020 | $4,468 | $416,000 | $161,000 | $255,000 |
| 2019 | $3,996 | $362,900 | $161,000 | $201,900 |
| 2018 | $3,898 | $340,100 | $146,400 | $193,700 |
| 2017 | $4,029 | $342,600 | $146,400 | $196,200 |
| 2016 | $4,079 | $342,200 | $146,400 | $195,800 |
| 2015 | $3,759 | $305,600 | $142,700 | $162,900 |
Source: Public Records
Map
Nearby Homes
- 12 Mansfield St
- 33 Ritchie Rd
- 1100 Salem St Unit 58
- 1100 Salem St Unit 46
- 1100 Salem St Unit 93
- 1100 Salem St Unit 75
- 1200 Salem St Unit 182
- 12 Casco Rd
- 50 Cumberland Cir
- 22 Broadmoor Ln Unit 22
- 0 Felton Ave
- 714 Lynnfield St
- 5 Otter Pond Rd
- 63 Crooker Dr
- 37 Locust St
- 325 Den Quarry Rd
- 1 Ingalls Terrace
- 159 Judge Rd
- 217 Cedar Brook Rd
- 54 Harris Rd