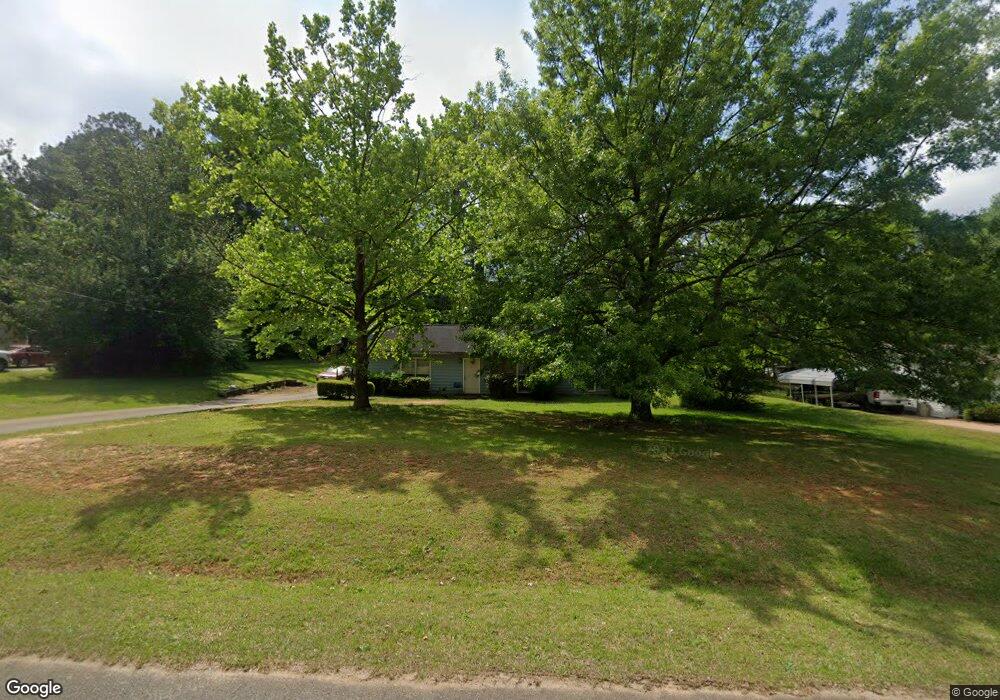
309 Moccasin Trail Lagrange, GA 30241
Estimated Value: $201,150 - $220,000
3
Beds
2
Baths
1,281
Sq Ft
$166/Sq Ft
Est. Value
About This Home
This home is located at 309 Moccasin Trail, Lagrange, GA 30241 and is currently estimated at $213,038, approximately $166 per square foot. 309 Moccasin Trail is a home located in Troup County with nearby schools including Callaway Elementary School, Hogansville Elementary School, and Callaway Middle School.
Ownership History
Date
Name
Owned For
Owner Type
Purchase Details
Closed on
Jul 8, 1999
Sold by
Sect Of Hud
Bought by
Dukes Tony V
Current Estimated Value
Purchase Details
Closed on
Feb 5, 1999
Sold by
Regions Mortgage Inc
Bought by
Sect Of Hud
Purchase Details
Closed on
Oct 14, 1998
Sold by
Williams Samuel C
Bought by
Regions Mortgage Inc
Purchase Details
Closed on
Feb 21, 1997
Sold by
Phillip Brooks
Bought by
Williams Samuel C
Purchase Details
Closed on
Jul 17, 1995
Sold by
Joseph Leonard Brazell
Bought by
Phillip Brooks
Purchase Details
Closed on
Mar 30, 1993
Sold by
Timothy G Morrow
Bought by
Joseph Leonard Brazell
Purchase Details
Closed on
Mar 1, 1987
Sold by
England Joe H and England Rebecca S
Bought by
Timothy G Morrow
Purchase Details
Closed on
May 4, 1984
Sold by
Jerry Averett Cont Inc
Bought by
England Joe H and England Rebecca S
Purchase Details
Closed on
Oct 1, 1983
Bought by
Jerry Averett Cont Inc
Create a Home Valuation Report for This Property
The Home Valuation Report is an in-depth analysis detailing your home's value as well as a comparison with similar homes in the area
Purchase History
We collect this data history from publicly available records. To have your information removed, we recommend requesting removal directly through your county’s website.
| Date | Buyer | Sale Price | Title Company |
|---|---|---|---|
| Dukes Tony V | $67,000 | -- | |
| Sect Of Hud | $80,900 | -- | |
| Regions Mortgage Inc | $80,900 | -- | |
| Williams Samuel C | $75,000 | -- | |
| Phillip Brooks | $71,500 | -- | |
| Joseph Leonard Brazell | $65,000 | -- | |
| Timothy G Morrow | $60,000 | -- | |
| England Joe H | -- | -- | |
| Jerry Averett Cont Inc | -- | -- |
Source: Public Records
Tax History
| Year | Tax Paid | Tax Assessment Tax Assessment Total Assessment is a certain percentage of the fair market value that is determined by local assessors to be the total taxable value of land and additions on the property. | Land | Improvement |
|---|---|---|---|---|
| 2025 | $1,488 | $57,640 | $10,000 | $47,640 |
| 2024 | $1,433 | $54,520 | $10,000 | $44,520 |
| 2023 | $1,512 | $57,440 | $10,000 | $47,440 |
| 2022 | $1,445 | $53,760 | $10,000 | $43,760 |
| 2021 | $1,167 | $40,680 | $8,000 | $32,680 |
| 2020 | $1,167 | $40,680 | $8,000 | $32,680 |
| 2019 | $883 | $31,280 | $4,800 | $26,480 |
| 2018 | $695 | $25,040 | $4,800 | $20,240 |
| 2017 | $695 | $25,040 | $4,800 | $20,240 |
| 2016 | $698 | $25,131 | $4,800 | $20,331 |
| 2015 | $700 | $25,131 | $4,800 | $20,331 |
| 2014 | $668 | $24,061 | $4,800 | $19,261 |
| 2013 | -- | $25,658 | $4,800 | $20,858 |
Source: Public Records
Map
Nearby Homes
- 10 Whitfield Rd
- 48 Briarwood Dr
- SMOKEMONT Smokemont Dr
- 119 Sir Lancelot St
- 124 Woodridge Cir
- 210 Old Pond Rd
- 202 Freshwater Ct
- 237 River Meadow Dr
- 438 Brookstone Dr
- 402 Sweetwood Ct Unit LOT 2
- 204 Freshwater Ct
- 206 Freshwater Ct
- 113 Shenandoah Ln
- 114 Shenandoah Ln
- 106 Shenandoah Ln Unit 26E
- 106 Shenandoah Ln
- 302 Glenhaven Dr
- 109 Shenandoah Ln
- 111 Shenandoah Ln
- 503 Headwater Ct
- 307 Moccasin Trail
- 311 Moccasin Trail
- 108 Beaver Run
- 110 Beaver Run
- 305 Moccasin Trail
- 308 Moccasin Trail
- 313 Moccasin Trail
- 306 Moccasin Trail
- 310 Moccasin Trail
- 112 Beaver Run
- 104 Beaver Run
- 304 Moccasin Trail
- 312 Moccasin Trail
- 303 Moccasin Trail Unit 79
- 303 Moccasin Trail
- 102 Beaver Run
- 302 Moccasin Trail
- 124 Beaver Creek Way Unit 254
- 124 Beaver Creek Way
- 111 Beaver Run
Your Personal Tour Guide
Ask me questions while you tour the home.