Estimated Value: $124,000 - $201,000
--
Bed
1
Bath
1,798
Sq Ft
$96/Sq Ft
Est. Value
About This Home
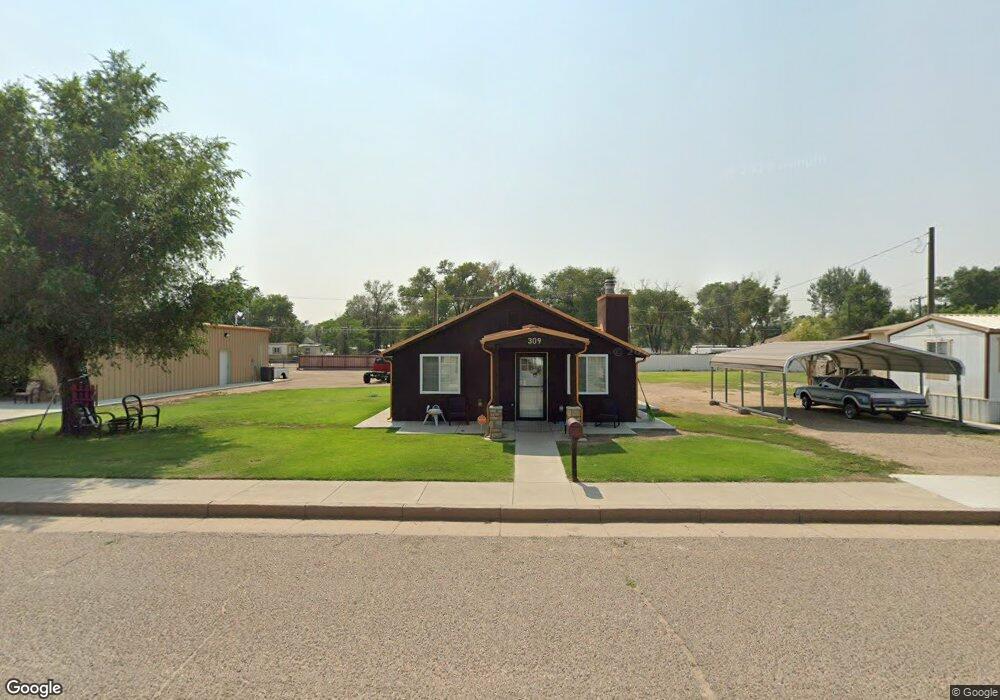
This home is located at 309 N 8th St, Lamar, CO 81052 and is currently estimated at $172,333, approximately $95 per square foot. 309 N 8th St is a home located in Prowers County with nearby schools including Washington Elementary School, Parkview Elementary School, and Lamar Middle School.
Ownership History
Date
Name
Owned For
Owner Type
Purchase Details
Closed on
Sep 11, 2020
Sold by
Esparza Jesus and Esparza Delores
Bought by
Aragon Jesus Octavio and Aragon Delores
Current Estimated Value
Home Financials for this Owner
Home Financials are based on the most recent Mortgage that was taken out on this home.
Original Mortgage
$49,000
Outstanding Balance
$34,890
Interest Rate
2.8%
Mortgage Type
New Conventional
Estimated Equity
$137,443
Purchase Details
Closed on
Nov 26, 2008
Sold by
Bumann Debra Kay and Bumann Kay
Bought by
Esparza Jesus and Esparza Delores
Home Financials for this Owner
Home Financials are based on the most recent Mortgage that was taken out on this home.
Original Mortgage
$25,294
Interest Rate
6.5%
Mortgage Type
Unknown
Purchase Details
Closed on
Sep 29, 2000
Sold by
Aragon Jesus O and Aragon Delores
Bought by
Aragon Jesus Octavio and Aragon Delores
Purchase Details
Closed on
Apr 26, 1984
Sold by
Henson Edward
Bought by
Bumann Terry and Bumann Kay
Create a Home Valuation Report for This Property
The Home Valuation Report is an in-depth analysis detailing your home's value as well as a comparison with similar homes in the area
Home Values in the Area
Average Home Value in this Area
Purchase History
| Date | Buyer | Sale Price | Title Company |
|---|---|---|---|
| Aragon Jesus Octavio | -- | None Available | |
| Esparza Jesus | $20,000 | None Available | |
| Aragon Jesus Octavio | -- | None Available | |
| Bumann Terry | $20,000 | -- |
Source: Public Records
Mortgage History
| Date | Status | Borrower | Loan Amount |
|---|---|---|---|
| Open | Aragon Jesus Octavio | $49,000 | |
| Previous Owner | Esparza Jesus | $25,294 |
Source: Public Records
Tax History Compared to Growth
Tax History
| Year | Tax Paid | Tax Assessment Tax Assessment Total Assessment is a certain percentage of the fair market value that is determined by local assessors to be the total taxable value of land and additions on the property. | Land | Improvement |
|---|---|---|---|---|
| 2024 | $202 | $0 | $0 | $0 |
| 2023 | $202 | $0 | $0 | $0 |
| 2022 | $202 | $0 | $0 | $0 |
| 2021 | $202 | $3,238 | $388 | $2,850 |
| 2020 | $125 | $2,080 | $438 | $1,642 |
| 2019 | $129 | $1,868 | $393 | $1,475 |
| 2018 | $121 | $1,743 | $396 | $1,347 |
| 2017 | $114 | $1,743 | $396 | $1,347 |
| 2016 | $186 | $2,856 | $438 | $2,418 |
| 2015 | $186 | $2,856 | $438 | $2,418 |
| 2014 | $174 | $2,667 | $438 | $2,229 |
Source: Public Records
Map
Nearby Homes