NOT LISTED FOR SALE

309 N Adams St Lewistown, IL 61542

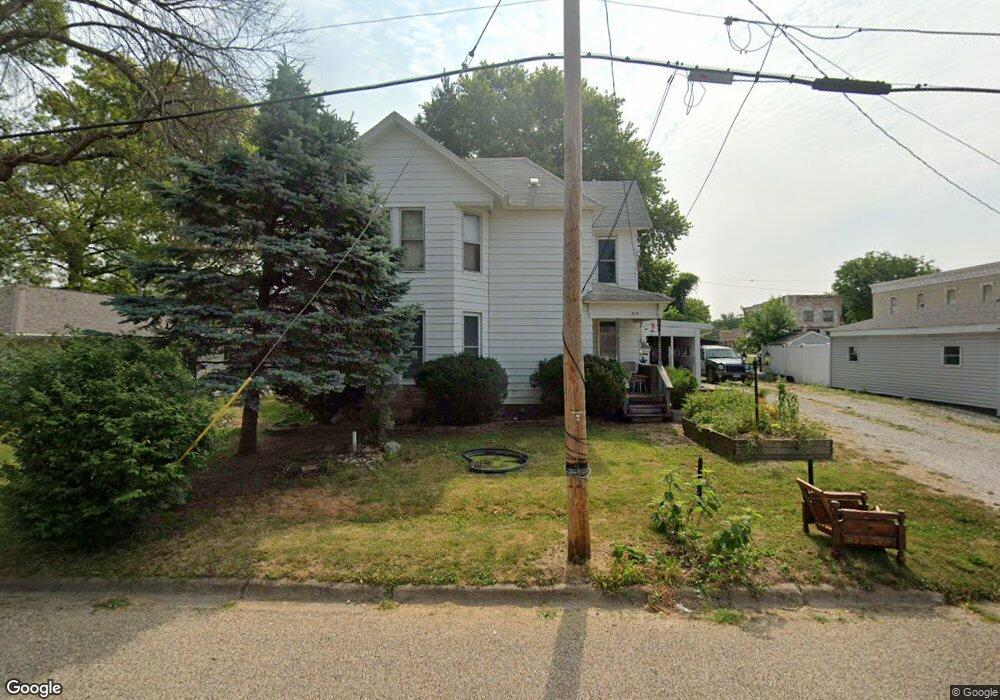
Estimated Value: $77,000 - $93,000

4 Beds
2 Baths
1,265 Sq Ft
$69/Sq Ft Est. Value

Last Sold August 15, 2019

Last sale price $27,500 $22 Per Sq Ft

Est. 217% increase in value since last sale

Current estimated payment $625/month

About This Home

As of August 2019

2 Story home with eat in Kitchen and Large Living Room, laundry on main floor with storage closet, washer and dryer stay.Bedroom down stair was dining room could easily remove panels and open it back to a dining room. 3 Bedrooms upstairs each with closets and storage space. Partial attic for storage. Covered Entrance that leads to the Fenced in yard with deck and fire pit. Carport 18 X 20, Shed 16 X 12

Ownership History

Date Name Owned For Owner Type

Purchase Details

Listed on
Jun 10, 2019
Closed on
Aug 15, 2019
Sold by
Metz Mark A
Bought by
Wilkinson Michelle
Seller's Agent
Jeanine Smith
Gorsuch Realty & Auction
Buyer's Agent
Jeanine Smith
Gorsuch Realty & Auction
List Price
$29,900
Sold Price
$27,500
Premium/Discount to List
-$2,400
-8.03%
Current Estimated Value
$87,220

Home Financials for this Owner

Home Financials are based on the most recent Mortgage that was taken out on this home.
Estimated Appreciation
$59,720
Avg. Annual Appreciation
20.61%
Original Mortgage
$22,000
Outstanding Balance
$19,268
Interest Rate
3.7%
Mortgage Type
Construction
Estimated Equity
$67,952
Source: Public Records

Range of Values:

Collateral Analytics

Collateral Analytics Collateral Analytics AVMs (Automated Valuation Model) employ a number of statistical approaches combined with neighborhood-specific comparable selection guarantees the most up-to-date and precise valuations.

Not Available

Collateral Analytics does not have data for the current month. Please view the chart for historical values.

ICE

ICE Mortgage Technology ICE Mortgage Technology’s AVM (Automated Valuation Model) is a state-of-the-art online residential property valuation tool that provides a quick and accurate estimate of the value of almost any home in the U.S.

Not Available

ICE Mortgage Technology does not have data for the current month. Please view the chart for historical values.

First American

First American First American Data & Analytics’ next-generation AVM combines unrivaled data assets with a blended ensemble of valuation models to produce highly accurate, reliable valuations you can trust.

Not Available

First American does not have data for the current month. Please view the chart for historical values.

Quantarium

Quantarium Quantarium’s valuation service, repeatedly proven the industry’s most accurate and comprehensive, is supercharged with a self-learning and auto-tuning AI engine that continually becomes smarter and more accurate as it processes daily inputs from the industry’s leading RE data lake.

Not Available

Quantarium does not have data for the current month. Please view the chart for historical values.

Average Value
Not Available
List Price
Sold Price
Create a Home Valuation Report for This Property
The Home Valuation Report is an in-depth analysis detailing your home's value as well as a comparison with similar homes in the area

Home Values in the Area

Source: Public Records

Average Home Value in this Area


Source: Public Records

Purchase History

Date Buyer Sale Price Title Company
Wilkinson Michelle $27,500 Terrill Title
Source: Public Records

Mortgage History

Date Status Borrower Loan Amount
Open Wilkinson Michelle $22,000
Source: Public Records

Property History

Date Event Price List to Sale Price per Sq Ft Prior Sale
08/15/2019 08/15/19 Sold $27,500 -8.0% $22 / Sq Ft View Prior Sale
07/17/2019 07/17/19 Pending -- -- --
06/10/2019 06/10/19 For Sale $29,900 -- $24 / Sq Ft

Tax History Compared to Growth

Source: Public Records

Tax History

Year Tax Paid Tax Assessment Tax Assessment Total Assessment is a certain percentage of the fair market value that is determined by local assessors to be the total taxable value of land and additions on the property. Land Improvement
2024 $1,923 $23,080 $2,270 $20,810
2023 $1,923 $22,080 $2,170 $19,910
2022 $1,993 $22,080 $2,170 $19,910
2021 $1,993 $19,630 $2,170 $17,460
2020 $1,879 $18,980 $2,100 $16,880
2019 $825 $19,280 $2,130 $17,150
2018 $732 $18,910 $2,090 $16,820
2017 $1,845 $18,910 $2,090 $16,820
2016 $726 $18,260 $2,020 $16,240
2015 $612 $18,260 $2,020 $16,240
2013 -- $17,800 $1,970 $15,830
2012 -- $17,360 $1,920 $15,440
Source: Public Records

Agents Affiliated with this Home

  • Section Image
See All Agents

Map