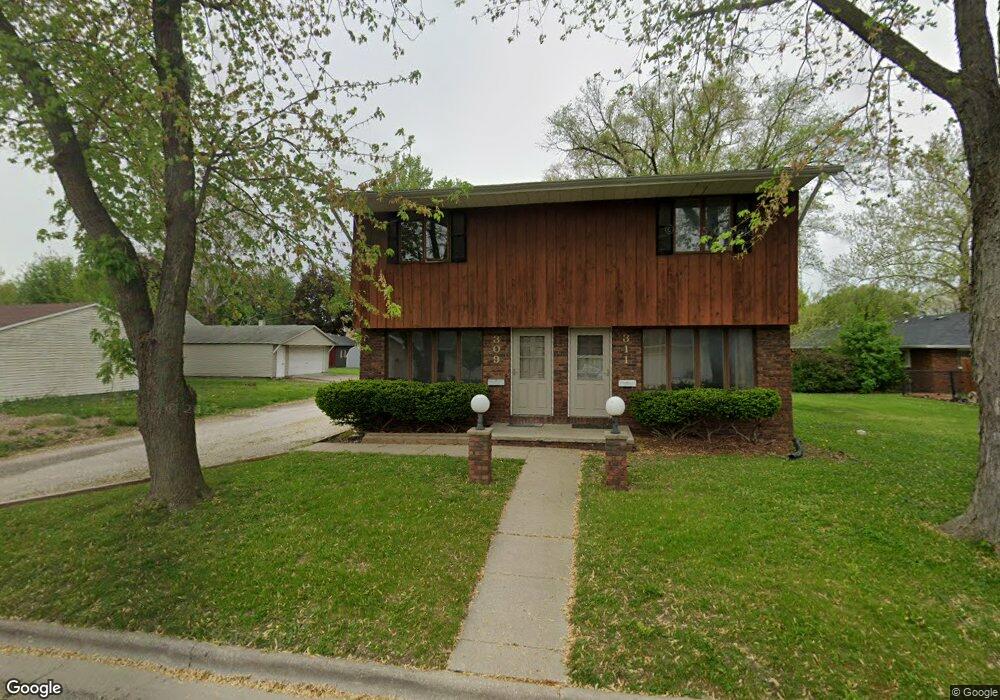
309 N Jackson St Lincoln, IL 62656
Estimated Value: $94,000 - $108,000
4
Beds
--
Bath
1,856
Sq Ft
$53/Sq Ft
Est. Value
About This Home
This home is located at 309 N Jackson St, Lincoln, IL 62656 and is currently estimated at $98,584, approximately $53 per square foot. 309 N Jackson St is a home located in Logan County with nearby schools including Northwest Elementary School, Lincoln Junior High School, and Lincoln Community High School.
Ownership History
Date
Name
Owned For
Owner Type
Purchase Details
Closed on
Aug 7, 2015
Sold by
Sanders William Edward
Bought by
Pierre Victor Jean
Current Estimated Value
Purchase Details
Closed on
Dec 27, 2012
Sold by
Baughman L Douglas
Bought by
Sanders William Edward and Sanders James Aaron
Home Financials for this Owner
Home Financials are based on the most recent Mortgage that was taken out on this home.
Original Mortgage
$56,250
Interest Rate
3.3%
Mortgage Type
Future Advance Clause Open End Mortgage
Create a Home Valuation Report for This Property
The Home Valuation Report is an in-depth analysis detailing your home's value as well as a comparison with similar homes in the area
Home Values in the Area
Average Home Value in this Area
Purchase History
| Date | Buyer | Sale Price | Title Company |
|---|---|---|---|
| Pierre Victor Jean | $55,000 | -- | |
| Sanders William Edward | -- | -- |
Source: Public Records
Mortgage History
| Date | Status | Borrower | Loan Amount |
|---|---|---|---|
| Previous Owner | Sanders William Edward | $56,250 |
Source: Public Records
Tax History
| Year | Tax Paid | Tax Assessment Tax Assessment Total Assessment is a certain percentage of the fair market value that is determined by local assessors to be the total taxable value of land and additions on the property. | Land | Improvement |
|---|---|---|---|---|
| 2024 | $2,085 | $23,060 | $5,130 | $17,930 |
| 2023 | $1,991 | $21,350 | $4,750 | $16,600 |
| 2022 | $1,936 | $19,910 | $4,430 | $15,480 |
| 2021 | $1,871 | $19,170 | $4,270 | $14,900 |
| 2020 | $1,874 | $19,170 | $4,270 | $14,900 |
| 2019 | $1,835 | $18,800 | $4,190 | $14,610 |
| 2018 | $1,788 | $18,080 | $4,030 | $14,050 |
| 2017 | $1,778 | $18,080 | $4,030 | $14,050 |
| 2016 | $1,754 | $18,290 | $4,080 | $14,210 |
| 2015 | $3,267 | $34,910 | $4,190 | $30,720 |
| 2014 | $3,267 | $34,910 | $4,190 | $30,720 |
| 2013 | $3,267 | $32,220 | $3,870 | $28,350 |
| 2012 | $3,267 | $32,690 | $3,930 | $28,760 |
Source: Public Records
Map
Nearby Homes
Your Personal Tour Guide
Ask me questions while you tour the home.