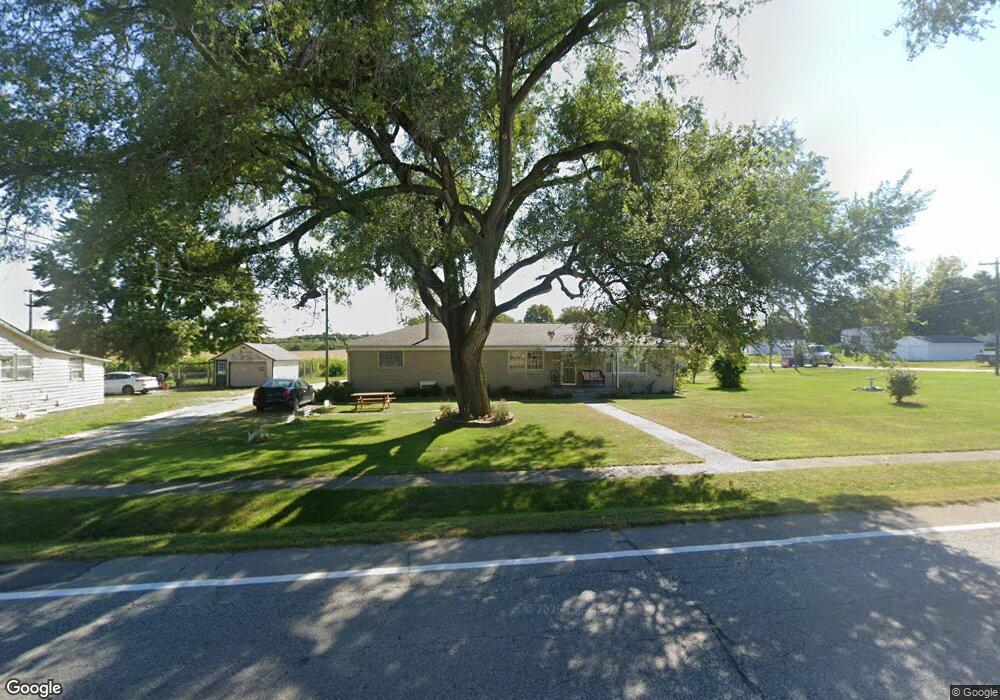
309 N Main St Linden, IN 47955
Estimated Value: $162,000 - $191,147
3
Beds
2
Baths
1,400
Sq Ft
$121/Sq Ft
Est. Value
About This Home
This home is located at 309 N Main St, Linden, IN 47955 and is currently estimated at $169,537, approximately $121 per square foot. 309 N Main St is a home located in Montgomery County with nearby schools including North Montgomery High School.
Ownership History
Date
Name
Owned For
Owner Type
Purchase Details
Closed on
Oct 25, 2017
Sold by
Traylor Andrew Clark
Bought by
Schriber Deborah L
Current Estimated Value
Home Financials for this Owner
Home Financials are based on the most recent Mortgage that was taken out on this home.
Original Mortgage
$79,797
Outstanding Balance
$66,831
Interest Rate
3.83%
Mortgage Type
New Conventional
Estimated Equity
$102,706
Create a Home Valuation Report for This Property
The Home Valuation Report is an in-depth analysis detailing your home's value as well as a comparison with similar homes in the area
Purchase History
| Date | Buyer | Sale Price | Title Company |
|---|---|---|---|
| Schriber Deborah L | -- | Security Abstract & Title Co |
Source: Public Records
Mortgage History
| Date | Status | Borrower | Loan Amount |
|---|---|---|---|
| Open | Schriber Deborah L | $79,797 |
Source: Public Records
Tax History
| Year | Tax Paid | Tax Assessment Tax Assessment Total Assessment is a certain percentage of the fair market value that is determined by local assessors to be the total taxable value of land and additions on the property. | Land | Improvement |
|---|---|---|---|---|
| 2024 | $734 | $117,000 | $25,600 | $91,400 |
| 2023 | $788 | $123,400 | $20,200 | $103,200 |
| 2022 | $670 | $105,800 | $20,200 | $85,600 |
| 2021 | $638 | $102,500 | $20,200 | $82,300 |
| 2020 | $534 | $97,500 | $20,200 | $77,300 |
| 2019 | $562 | $97,700 | $20,300 | $77,400 |
| 2018 | $449 | $92,200 | $20,800 | $71,400 |
| 2017 | $406 | $86,500 | $20,800 | $65,700 |
| 2016 | $198 | $83,800 | $20,800 | $63,000 |
| 2014 | $144 | $81,300 | $20,100 | $61,200 |
| 2013 | $144 | $83,200 | $20,100 | $63,100 |
Source: Public Records
Map
Nearby Homes
Your Personal Tour Guide
Ask me questions while you tour the home.