Estimated Value: $212,384 - $218,000
3
Beds
2
Baths
1,581
Sq Ft
$136/Sq Ft
Est. Value
About This Home
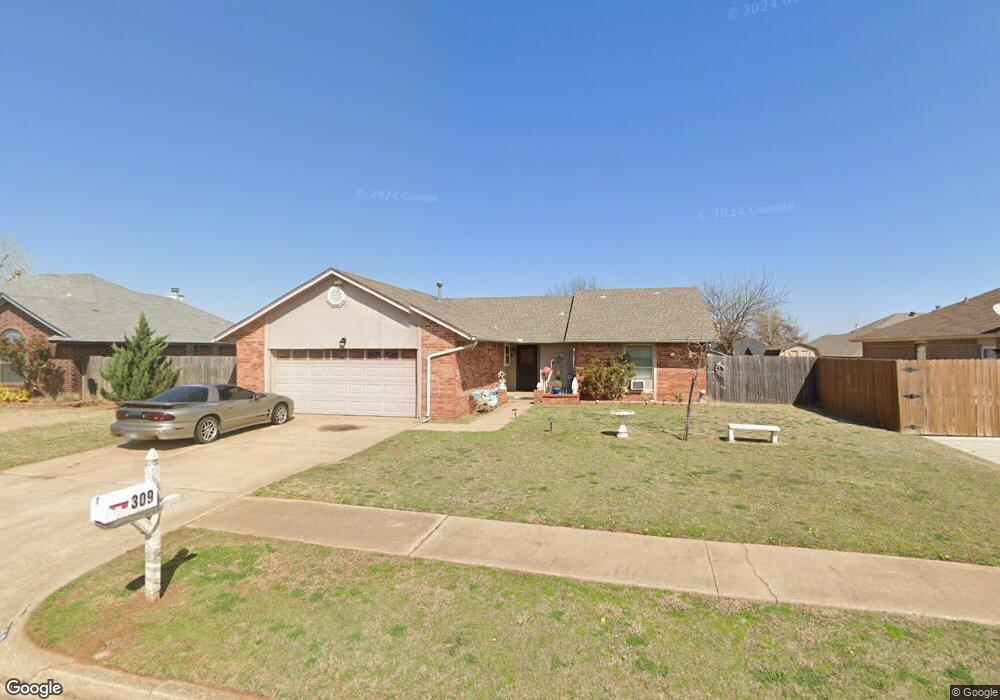
This home is located at 309 NE 16th St, Moore, OK 73160 and is currently estimated at $215,096, approximately $136 per square foot. 309 NE 16th St is a home located in Cleveland County with nearby schools including Northmoor Elementary School, Central Junior High School, and Moore High School.
Ownership History
Date
Name
Owned For
Owner Type
Purchase Details
Closed on
Nov 17, 2011
Sold by
Davis Gregory E and Davis Cynthia L
Bought by
Munoz Ranberto
Current Estimated Value
Home Financials for this Owner
Home Financials are based on the most recent Mortgage that was taken out on this home.
Original Mortgage
$113,059
Outstanding Balance
$76,447
Interest Rate
4.15%
Mortgage Type
FHA
Estimated Equity
$138,649
Purchase Details
Closed on
May 30, 2008
Sold by
Jernigan Mark R and Jernigan Mark Raymond
Bought by
Davis Gregory E and Davis Cynthia L
Home Financials for this Owner
Home Financials are based on the most recent Mortgage that was taken out on this home.
Original Mortgage
$108,300
Interest Rate
5.89%
Mortgage Type
New Conventional
Purchase Details
Closed on
Aug 18, 2006
Sold by
Baker Donita R
Bought by
Jernigan Mark Raymond
Purchase Details
Closed on
Oct 29, 2002
Sold by
Storts Blaine David
Bought by
Jernigan Mark R
Create a Home Valuation Report for This Property
The Home Valuation Report is an in-depth analysis detailing your home's value as well as a comparison with similar homes in the area
Home Values in the Area
Average Home Value in this Area
Purchase History
| Date | Buyer | Sale Price | Title Company |
|---|---|---|---|
| Munoz Ranberto | $116,000 | Stewart Abstract & Title Ok | |
| Davis Gregory E | $114,000 | None Available | |
| Jernigan Mark Raymond | -- | None Available | |
| Jernigan Mark R | $88,500 | -- |
Source: Public Records
Mortgage History
| Date | Status | Borrower | Loan Amount |
|---|---|---|---|
| Open | Munoz Ranberto | $113,059 | |
| Previous Owner | Davis Gregory E | $108,300 |
Source: Public Records
Tax History
| Year | Tax Paid | Tax Assessment Tax Assessment Total Assessment is a certain percentage of the fair market value that is determined by local assessors to be the total taxable value of land and additions on the property. | Land | Improvement |
|---|---|---|---|---|
| 2025 | $2,304 | $18,813 | $3,613 | $15,200 |
| 2023 | $2,081 | $17,064 | $3,410 | $13,654 |
| 2022 | $2,010 | $16,251 | $3,545 | $12,706 |
| 2021 | $1,924 | $15,477 | $3,506 | $11,971 |
| 2020 | $1,832 | $14,740 | $2,400 | $12,340 |
| 2019 | $1,867 | $14,740 | $2,400 | $12,340 |
| 2018 | $1,867 | $14,741 | $2,400 | $12,341 |
| 2017 | $1,877 | $14,741 | $0 | $0 |
| 2016 | $1,864 | $14,543 | $2,368 | $12,175 |
| 2015 | $1,607 | $13,850 | $2,255 | $11,595 |
| 2014 | $1,566 | $13,191 | $1,740 | $11,451 |
Source: Public Records
Map
Nearby Homes
- 1924 Parkside Dr
- 904 NE 17th St
- 2116 Fox Ave
- 2300 Cowan Place
- 904 NE 21st St
- 707 Crestmoor Dr
- 2212 Fox Ave
- 2205 Bellaire Dr
- 100 Bellaire Dr
- 1100 Elmhurst St
- 1109 E Hills Dr
- 413 Sherwood Dr
- 1113 NE 21st Ct
- 1404 Old Mill Rd
- 1905 Julie Dr
- 106 Briarwood St
- 115 Briarwood St
- 203 Eberle Dr
- 1124 NE 8th St
- 940 NE 28th St
- 309 NE 16th St
- 305 NE 16th St
- 313 NE 16th St
- 520 Fire Light Dr
- 524 Fire Light Dr
- 516 Fire Light Dr
- 301 NE 16th St
- 528 Fire Light Dr
- 317 NE 16th St
- 308 NE 16th St
- 304 NE 16th St
- 512 Fire Light Dr
- 312 NE 16th St
- 532 Fire Light Dr
- 300 NE 16th St
- 401 NE 16th St
- 508 Fire Light Dr
- 316 NE 16th St
- 1709 Smoking Tree St
- 536 Fire Light Dr
Your Personal Tour Guide
Ask me questions while you tour the home.