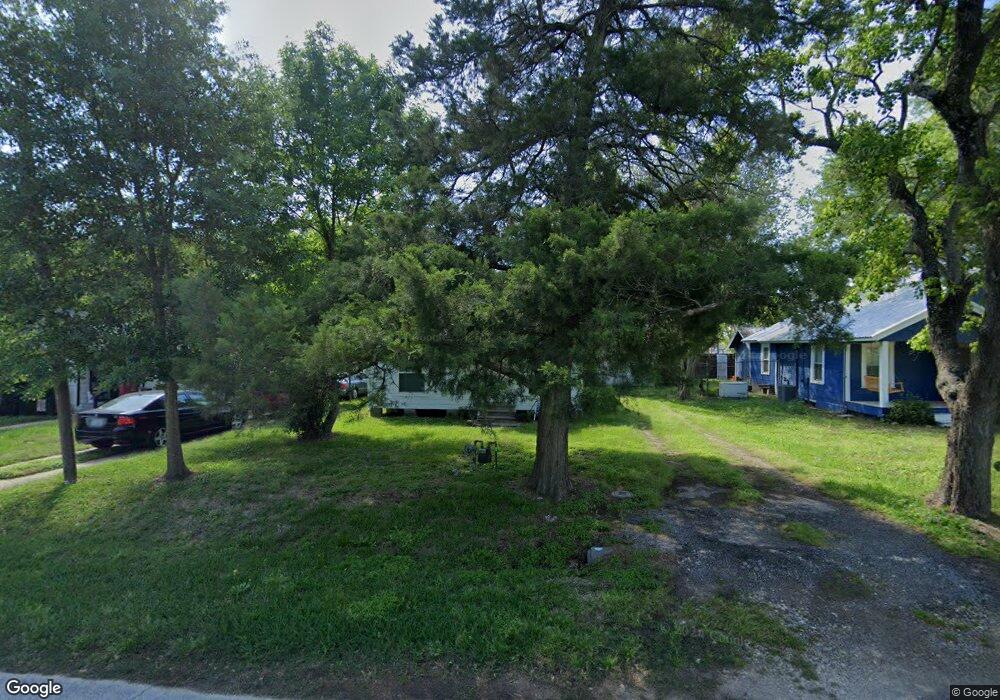
309 Oxford St Tomball, TX 77375
Estimated Value: $168,003 - $239,000
2
Beds
1
Bath
875
Sq Ft
$235/Sq Ft
Est. Value
About This Home
This home is located at 309 Oxford St, Tomball, TX 77375 and is currently estimated at $205,501, approximately $234 per square foot. 309 Oxford St is a home located in Harris County with nearby schools including Tomball Elementary School, Tomball Intermediate School, and Tomball Junior High School.
Ownership History
Date
Name
Owned For
Owner Type
Purchase Details
Closed on
Jan 17, 2019
Sold by
Kreitz Virginia A
Bought by
Sclider Joseph E
Current Estimated Value
Purchase Details
Closed on
Jan 29, 1999
Sold by
Imperial Homes Fairmont Park Llc
Bought by
Parden Rodney Edward and Parden Billie Jo
Home Financials for this Owner
Home Financials are based on the most recent Mortgage that was taken out on this home.
Original Mortgage
$111,948
Interest Rate
6.79%
Mortgage Type
VA
Purchase Details
Closed on
Jan 1, 1999
Sold by
Investcorp Financial Inc
Bought by
Investcorp Financial Group Lc
Home Financials for this Owner
Home Financials are based on the most recent Mortgage that was taken out on this home.
Original Mortgage
$111,948
Interest Rate
6.79%
Mortgage Type
VA
Purchase Details
Closed on
Dec 18, 1984
Sold by
Sclider Ann
Bought by
Sclider Dora
Create a Home Valuation Report for This Property
The Home Valuation Report is an in-depth analysis detailing your home's value as well as a comparison with similar homes in the area
Home Values in the Area
Average Home Value in this Area
Purchase History
| Date | Buyer | Sale Price | Title Company |
|---|---|---|---|
| Sclider Joseph E | $12,812 | None Available | |
| Parden Rodney Edward | -- | First Southwestern Title Co | |
| Investcorp Financial Group Lc | -- | Partners Title Company | |
| Finkelstein Partners Ltd | -- | -- | |
| Sclider Dora | -- | -- |
Source: Public Records
Mortgage History
| Date | Status | Borrower | Loan Amount |
|---|---|---|---|
| Previous Owner | Parden Rodney Edward | $111,948 |
Source: Public Records
Tax History Compared to Growth
Tax History
| Year | Tax Paid | Tax Assessment Tax Assessment Total Assessment is a certain percentage of the fair market value that is determined by local assessors to be the total taxable value of land and additions on the property. | Land | Improvement |
|---|---|---|---|---|
| 2025 | $1,097 | $149,569 | $96,750 | $52,819 |
| 2024 | $1,097 | $143,000 | $90,300 | $52,700 |
| 2023 | $1,097 | $130,200 | $77,400 | $52,800 |
| 2022 | $1,931 | $103,700 | $58,050 | $45,650 |
| 2021 | $1,860 | $78,439 | $41,925 | $36,514 |
| 2020 | $1,737 | $70,813 | $32,250 | $38,563 |
| 2019 | $1,600 | $63,433 | $25,800 | $37,633 |
| 2018 | $828 | $61,821 | $25,800 | $36,021 |
| 2017 | $1,558 | $61,821 | $25,800 | $36,021 |
| 2016 | $1,465 | $58,121 | $25,800 | $32,321 |
| 2015 | $1,200 | $58,121 | $25,800 | $32,321 |
| 2014 | $1,200 | $47,142 | $25,800 | $21,342 |
Source: Public Records
Map
Nearby Homes
- 20734 Open Range Ct
- 18818 Cornelia Fields Ln
- 18723 Buttercup Farms Ln
- 20718 Open Range Ct
- 19951 Epona Creek Dr
- 19935 Epona Creek Dr
- 18707 Buttercup Farms Ln
- 20710 Open Range Ct
- 18826 Cornelia Fields Ln
- 20714 Open Range Ct
- 0 N Sycamore St
- 504 Percival St Unit A
- Lot 46 Moore St
- Lot 45 Moore St
- 306 E Main St
- 505 Percival St
- 516 Clayton St
- 650 Texas St
- TBD Clayton St
- 315 Mechanic St