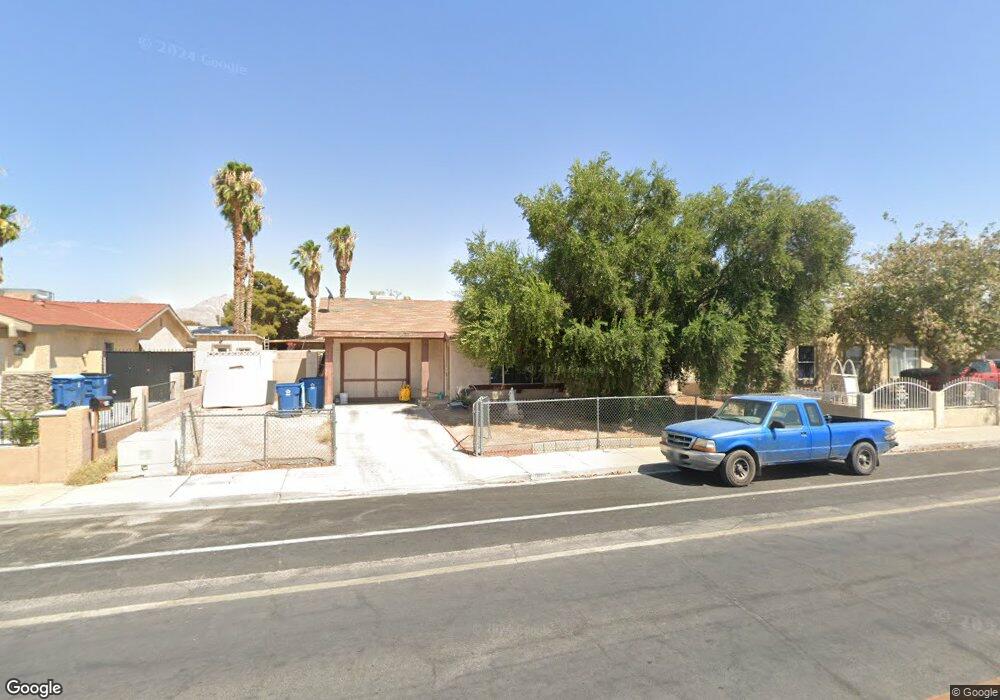
309 Page St Las Vegas, NV 89110
East Las Vegas NeighborhoodEstimated Value: $268,347 - $313,000
2
Beds
1
Bath
806
Sq Ft
$366/Sq Ft
Est. Value
About This Home
This home is located at 309 Page St, Las Vegas, NV 89110 and is currently estimated at $295,337, approximately $366 per square foot. 309 Page St is a home located in Clark County with nearby schools including Elbert Edwards Elementary School, Dell H Robison Middle School, and Eldorado High School.
Ownership History
Date
Name
Owned For
Owner Type
Purchase Details
Closed on
Oct 15, 2007
Sold by
Decarranza Yenni Araujo
Bought by
Carranza Vazquez Andres
Current Estimated Value
Purchase Details
Closed on
Oct 12, 2007
Sold by
Carranza Vazquez Andres and Carranza Andres
Bought by
Carranza Vazquez Andres
Purchase Details
Closed on
Apr 5, 2004
Sold by
Richmond Gregory F and Arias Richmond Barbara M
Bought by
Carranza Andres
Home Financials for this Owner
Home Financials are based on the most recent Mortgage that was taken out on this home.
Original Mortgage
$119,130
Outstanding Balance
$55,003
Interest Rate
5.39%
Mortgage Type
FHA
Estimated Equity
$240,334
Purchase Details
Closed on
Feb 26, 1999
Sold by
Crist Patrick J and Crist Jillayne
Bought by
Richmond Gregory F and Arias Richmond Barbara M
Home Financials for this Owner
Home Financials are based on the most recent Mortgage that was taken out on this home.
Original Mortgage
$63,200
Interest Rate
6.78%
Create a Home Valuation Report for This Property
The Home Valuation Report is an in-depth analysis detailing your home's value as well as a comparison with similar homes in the area
Home Values in the Area
Average Home Value in this Area
Purchase History
| Date | Buyer | Sale Price | Title Company |
|---|---|---|---|
| Carranza Vazquez Andres | -- | Fidelity National Title | |
| Carranza Vazquez Andres | -- | Fidelity National Title | |
| Carranza Andres | $121,000 | Ticor Title Of Nevada Inc | |
| Richmond Gregory F | $79,000 | Nevada Title Company |
Source: Public Records
Mortgage History
| Date | Status | Borrower | Loan Amount |
|---|---|---|---|
| Open | Carranza Andres | $119,130 | |
| Previous Owner | Richmond Gregory F | $63,200 |
Source: Public Records
Tax History Compared to Growth
Tax History
| Year | Tax Paid | Tax Assessment Tax Assessment Total Assessment is a certain percentage of the fair market value that is determined by local assessors to be the total taxable value of land and additions on the property. | Land | Improvement |
|---|---|---|---|---|
| 2025 | $593 | $38,567 | $24,150 | $14,417 |
| 2024 | $576 | $38,567 | $24,150 | $14,417 |
| 2023 | $470 | $40,968 | $26,600 | $14,368 |
| 2022 | $559 | $36,191 | $22,750 | $13,441 |
| 2021 | $543 | $34,026 | $21,000 | $13,026 |
| 2020 | $524 | $32,466 | $19,250 | $13,216 |
| 2019 | $509 | $29,028 | $15,750 | $13,278 |
| 2018 | $494 | $26,256 | $13,300 | $12,956 |
| 2017 | $838 | $25,564 | $12,250 | $13,314 |
| 2016 | $470 | $20,845 | $7,000 | $13,845 |
| 2015 | $467 | $18,784 | $5,600 | $13,184 |
| 2014 | $453 | $14,040 | $4,200 | $9,840 |
Source: Public Records
Map
Nearby Homes
- 4428 Ash Ave
- 4436 E Ogden Ave
- 4632 Shoen Ave
- 408 Rhoda St
- 132 Hillsway Dr
- 4437 Isabella Ave
- 416 Martha St
- 4649 Cuva Ct Unit 4
- 255 N Lamb Blvd Unit D
- 413 N Lamb Blvd Unit F
- 4424 Sunrise Ave
- 409 Marion Dr
- 4533 Diamond Head Dr
- 45 Logan Ct
- 4705 Elm Ave
- 52 Madras Cir
- 425 N Lamb Blvd Unit D
- 211 N Lamb Blvd Unit A
- 211 N Lamb Blvd Unit D
- 213 N Lamb Blvd Unit F