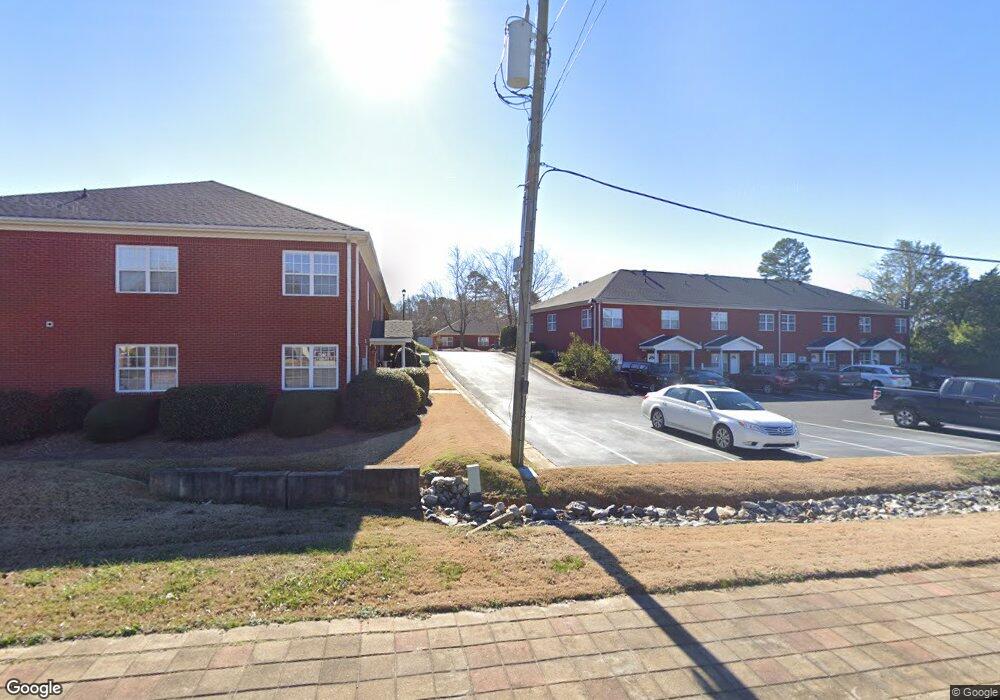
309 Pirkle Ferry Rd Unit B-300 Cumming, GA 30040
Estimated Value: $154,798
1
Bed
1
Bath
1,140
Sq Ft
$136/Sq Ft
Est. Value
About This Home
This home is located at 309 Pirkle Ferry Rd Unit B-300, Cumming, GA 30040 and is currently estimated at $154,798, approximately $135 per square foot. 309 Pirkle Ferry Rd Unit B-300 is a home located in Forsyth County with nearby schools including Cumming Elementary School, Otwell Middle School, and Forsyth Central High School.
Ownership History
Date
Name
Owned For
Owner Type
Purchase Details
Closed on
Oct 29, 2021
Sold by
Woodward Cindy
Bought by
Womac Robert J and Womac Wendy D
Current Estimated Value
Home Financials for this Owner
Home Financials are based on the most recent Mortgage that was taken out on this home.
Original Mortgage
$35,356
Outstanding Balance
$21,602
Interest Rate
3.01%
Mortgage Type
Commercial
Estimated Equity
$133,196
Purchase Details
Closed on
Sep 5, 2017
Sold by
Mcfarland Properties Inc
Bought by
Woodward Cindy
Home Financials for this Owner
Home Financials are based on the most recent Mortgage that was taken out on this home.
Original Mortgage
$127,076
Interest Rate
3.9%
Mortgage Type
New Conventional
Purchase Details
Closed on
Jun 25, 2010
Sold by
Arrowghead Group Llc
Bought by
Mcfarland Properties Inc
Create a Home Valuation Report for This Property
The Home Valuation Report is an in-depth analysis detailing your home's value as well as a comparison with similar homes in the area
Home Values in the Area
Average Home Value in this Area
Purchase History
| Date | Buyer | Sale Price | Title Company |
|---|---|---|---|
| Womac Robert J | $117,400 | -- | |
| Woodward Cindy | $250,000 | -- | |
| Mcfarland Properties Inc | $117,500 | -- |
Source: Public Records
Mortgage History
| Date | Status | Borrower | Loan Amount |
|---|---|---|---|
| Open | Womac Robert J | $35,356 | |
| Previous Owner | Woodward Cindy | $127,076 |
Source: Public Records
Tax History Compared to Growth
Tax History
| Year | Tax Paid | Tax Assessment Tax Assessment Total Assessment is a certain percentage of the fair market value that is determined by local assessors to be the total taxable value of land and additions on the property. | Land | Improvement |
|---|---|---|---|---|
| 2025 | $1,964 | $96,000 | $20,000 | $76,000 |
| 2024 | $1,964 | $80,104 | $20,000 | $60,104 |
| 2023 | $1,571 | $63,840 | $20,000 | $43,840 |
| 2022 | $1,250 | $56,230 | $20,000 | $36,230 |
| 2021 | $1,553 | $56,230 | $20,000 | $36,230 |
| 2020 | $1,553 | $56,230 | $20,000 | $36,230 |
| 2019 | $1,440 | $52,084 | $20,000 | $32,084 |
| 2018 | $1,311 | $47,400 | $20,000 | $27,400 |
| 2017 | $1,316 | $47,400 | $20,000 | $27,400 |
| 2016 | $1,316 | $47,400 | $20,000 | $27,400 |
| 2015 | $1,221 | $43,912 | $20,000 | $23,912 |
| 2014 | $1,162 | $43,908 | $20,000 | $23,908 |
Source: Public Records
Map
Nearby Homes
- 208 Pirkle Ferry Rd
- 116 E Maple St
- 4945 Bay Dr
- 0 Georgia 400 Unit 7490148
- 280 Oxford Rd
- 1225 Westshore Dr
- The Maren Plan at Brackley - Single Family
- The Manchester Plan at Brackley - Single Family
- The Greenville Plan at Brackley - Single Family
- 102 Birch Tree Way
- 104 Brackley Dr
- 535 Shamrock Dr
- 112 Brackley Dr
- 1250 Winterhaven Dr
- 110 Mountain View Dr
- 515 Pearl St
- 520 Pearl St
- 533 Pearl St
- 1269 Windmill Pkwy
- 522 Pearl St
- 309 Pirkle Ferry Rd Unit E200
- 309 Pirkle Ferry Rd Unit D-200
- 309 Pirkle Ferry Rd Unit D-100
- 309 Pirkle Ferry Rd Unit B-400
- 309 Pirkle Ferry Rd Unit A100
- 309 Pirkle Ferry Rd Unit C200
- 309 Pirkle Ferry Rd
- 309 Pirkle Ferry Rd Unit A400
- 303 Pirkle Ferry Rd
- 404 Pirkle Ferry Rd
- 0 Pirkle Ferry Rd
- 0 Oakland St
- 408 Pirkle Ferry Rd Unit 103
- 408 Pirkle Ferry Rd Unit A
- 408 Pirkle Ferry Rd
- 146 Eastern Cir
- 407 E Maple St Unit 106
- 407 E Maple St Unit 303
- 407 E Maple St Unit 112
- 110 Allen St Unit 3