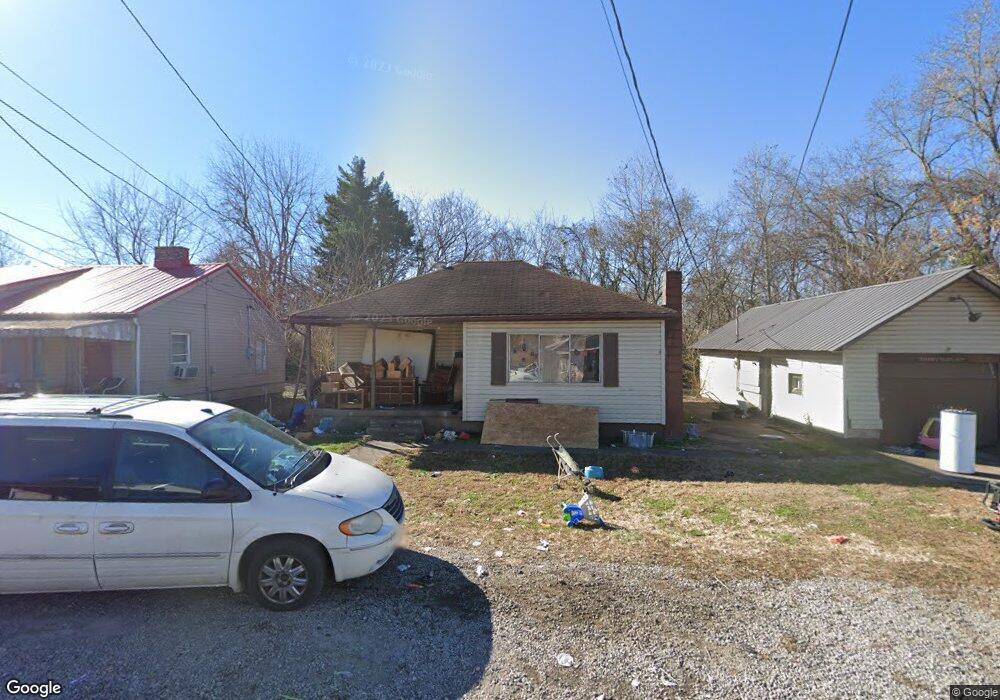
309 Ridgeway St Coal Grove, OH 45638
Estimated Value: $65,000 - $92,000
3
Beds
1
Bath
952
Sq Ft
$86/Sq Ft
Est. Value
About This Home
This home is located at 309 Ridgeway St, Coal Grove, OH 45638 and is currently estimated at $81,659, approximately $85 per square foot. 309 Ridgeway St is a home located in Lawrence County with nearby schools including Dawson-Bryant Elementary School, Dawson-Bryant Middle School, and Dawson-Bryant High School.
Ownership History
Date
Name
Owned For
Owner Type
Purchase Details
Closed on
Sep 23, 2024
Sold by
Jackson David A
Bought by
Jackson David A and Jackson Kelli Jean
Current Estimated Value
Purchase Details
Closed on
Jan 24, 2023
Sold by
Wilson Jerry
Bought by
Jackson David A
Purchase Details
Closed on
Jan 20, 2023
Sold by
Carey Jody
Bought by
Wilson Jerry
Purchase Details
Closed on
Jul 31, 2019
Sold by
Carey Judy S and Carey Jody
Bought by
Carey Jody
Purchase Details
Closed on
Oct 4, 2018
Sold by
Carey Judy S
Bought by
Carey Jody
Purchase Details
Closed on
Jul 8, 2009
Sold by
Bryant William R and Bryant Genevieve
Bought by
Carey Judy Sue
Purchase Details
Closed on
Mar 22, 2000
Bought by
Bryant William and Bryant Genev
Purchase Details
Closed on
Nov 16, 1999
Sold by
Turley Dennis and Turley Rebecca
Bought by
The Travelers Bank
Purchase Details
Closed on
May 28, 1985
Sold by
Poynor Catherine
Bought by
Turley Dennis and Turley Rebecca
Create a Home Valuation Report for This Property
The Home Valuation Report is an in-depth analysis detailing your home's value as well as a comparison with similar homes in the area
Home Values in the Area
Average Home Value in this Area
Purchase History
| Date | Buyer | Sale Price | Title Company |
|---|---|---|---|
| Jackson David A | -- | None Listed On Document | |
| Jackson David A | -- | None Listed On Document | |
| Jackson David A | $10,000 | -- | |
| Wilson Jerry | $10,000 | -- | |
| Carey Jody | -- | -- | |
| Carey Jody | -- | -- | |
| Carey Judy Sue | -- | Attorney | |
| Bryant William | $15,000 | -- | |
| The Travelers Bank | $14,700 | -- | |
| Turley Dennis | $14,000 | -- |
Source: Public Records
Tax History
| Year | Tax Paid | Tax Assessment Tax Assessment Total Assessment is a certain percentage of the fair market value that is determined by local assessors to be the total taxable value of land and additions on the property. | Land | Improvement |
|---|---|---|---|---|
| 2025 | $674 | $19,821 | $6,454 | $13,367 |
| 2024 | -- | $19,240 | $5,870 | $13,370 |
| 2023 | $674 | $19,240 | $5,870 | $13,370 |
| 2022 | $682 | $19,240 | $5,870 | $13,370 |
| 2021 | $510 | $16,740 | $5,450 | $11,290 |
| 2020 | $611 | $16,740 | $5,450 | $11,290 |
| 2019 | $609 | $16,740 | $5,450 | $11,290 |
| 2018 | $615 | $16,740 | $5,450 | $11,290 |
| 2017 | $614 | $16,740 | $5,450 | $11,290 |
| 2016 | $575 | $16,740 | $5,450 | $11,290 |
| 2015 | $581 | $15,720 | $5,450 | $10,270 |
| 2014 | $544 | $15,720 | $5,450 | $10,270 |
| 2013 | $543 | $15,720 | $5,450 | $10,270 |
Source: Public Records
Map
Nearby Homes
- 222 Saint Charles St
- 805 1/2 High St
- 514 Lane St
- 519 Lane St
- 303 Pike St
- 105 Compliment St
- 103 Carrico Dr
- 0 Central & Mlk
- 1003 Marion Pike
- 1400 Montgomery Ave
- 1417 Lexington Ave
- 1824 Carter Ave
- 0 18th Street & Central Ave
- 1100 Price St
- 1336 High St W
- 0 Carter Ave
- 601 Pollard Rd
- 0 Pollard Rd
- 000 Chestnut Hill Dr
- 0 Central Ave
- 307 Ridgeway St
- 313 Ridgeway St
- 305 Ridgeway St
- 315 Ridgeway St
- 303 Ridgeway St
- 310 Ridgeway St
- 308 Ridgeway St
- 306 Ridgeway St
- 301 Ridgeway St
- 304 Ridgeway St
- 301 1/2 Ridgeway St
- 302 Ridgeway St
- 322 Ridgeway St
- 900 High St
- 214 Ridgeway St
- 215 Ridgeway St
- 202 Elm St
- 108 Fernwood Dr
- 213 Ridgeway St
- 200 Elm St
Your Personal Tour Guide
Ask me questions while you tour the home.