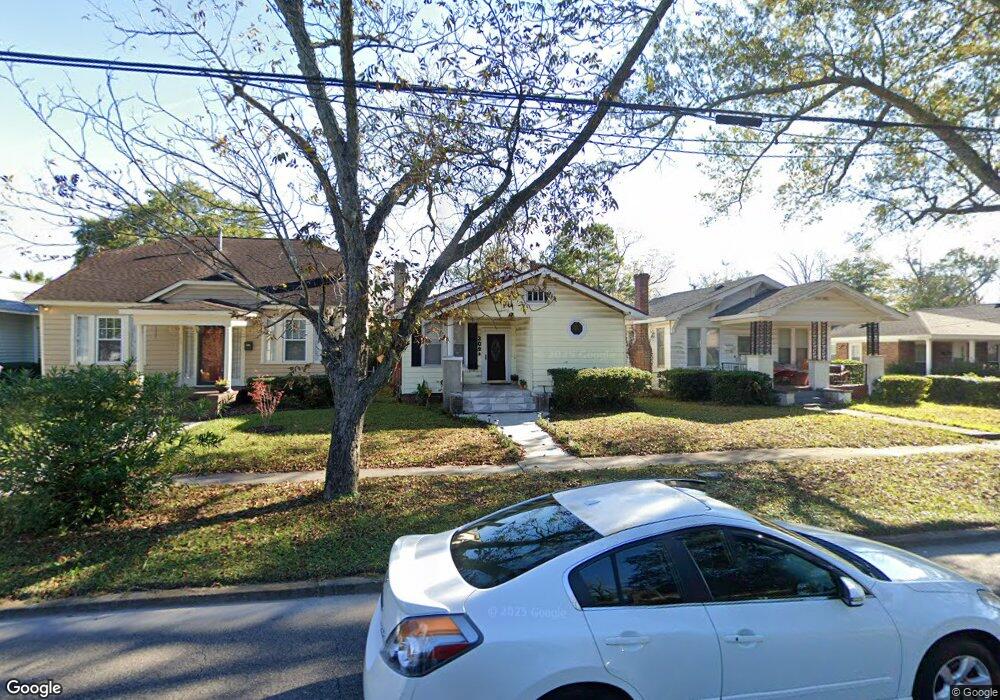
309 S 16th St Wilmington, NC 28401
The Bottom NeighborhoodEstimated Value: $368,000 - $409,000
3
Beds
1
Bath
1,492
Sq Ft
$256/Sq Ft
Est. Value
About This Home
This home is located at 309 S 16th St, Wilmington, NC 28401 and is currently estimated at $381,247, approximately $255 per square foot. 309 S 16th St is a home located in New Hanover County with nearby schools including Snipes Academy of Arts & Design, Williston Middle School, and John T. Hoggard High School.
Ownership History
Date
Name
Owned For
Owner Type
Purchase Details
Closed on
Apr 30, 2002
Sold by
Devane Rugina Diane Aka Rugena
Bought by
Devane Rugena Diane
Current Estimated Value
Purchase Details
Closed on
Jun 10, 1998
Sold by
Keels Lawrence
Bought by
Devane Rugina Diane
Purchase Details
Closed on
Feb 17, 1995
Sold by
Thames James Edward
Bought by
Keels Lawrence
Purchase Details
Closed on
Feb 1, 1981
Sold by
Carolina Savings & Loan
Bought by
Thames James Edwrd
Purchase Details
Closed on
Jun 1, 1980
Sold by
Tobias Clarence Vernell
Bought by
Carolina Savings & Loan
Create a Home Valuation Report for This Property
The Home Valuation Report is an in-depth analysis detailing your home's value as well as a comparison with similar homes in the area
Home Values in the Area
Average Home Value in this Area
Purchase History
| Date | Buyer | Sale Price | Title Company |
|---|---|---|---|
| Devane Rugena Diane | -- | -- | |
| Devane Rugina Diane | -- | -- | |
| Keels Lawrence | -- | -- | |
| Thames James Edwrd | -- | -- | |
| Carolina Savings & Loan | -- | -- |
Source: Public Records
Tax History Compared to Growth
Tax History
| Year | Tax Paid | Tax Assessment Tax Assessment Total Assessment is a certain percentage of the fair market value that is determined by local assessors to be the total taxable value of land and additions on the property. | Land | Improvement |
|---|---|---|---|---|
| 2025 | $2,175 | $369,600 | $87,000 | $282,600 |
| 2023 | $1,503 | $172,800 | $56,200 | $116,600 |
| 2022 | $1,469 | $172,800 | $56,200 | $116,600 |
| 2021 | $1,479 | $172,800 | $56,200 | $116,600 |
| 2020 | $1,127 | $107,000 | $35,000 | $72,000 |
| 2019 | $1,127 | $107,000 | $35,000 | $72,000 |
| 2018 | $979 | $107,000 | $35,000 | $72,000 |
| 2017 | $1,127 | $107,000 | $35,000 | $72,000 |
| 2016 | $985 | $88,900 | $31,700 | $57,200 |
| 2015 | $941 | $88,900 | $31,700 | $57,200 |
| 2014 | $901 | $88,900 | $31,700 | $57,200 |
Source: Public Records
Map
Nearby Homes