Estimated Value: $49,687
--
Bed
--
Bath
1,268
Sq Ft
$39/Sq Ft
Est. Value
About This Home
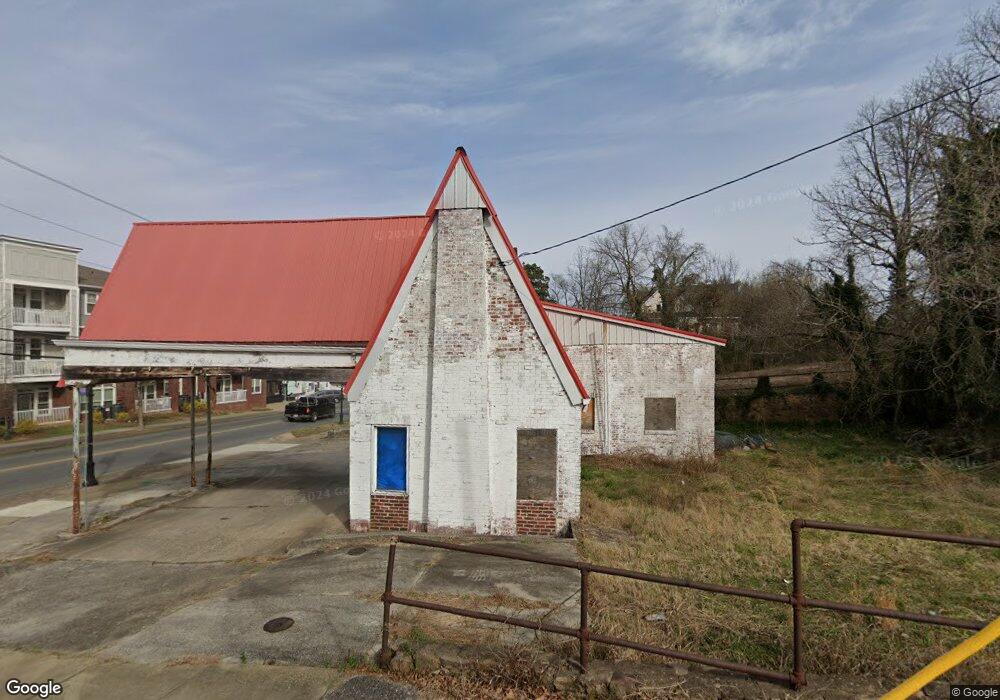
This home is located at 309 S Broad St SW, Rome, GA 30161 and is currently estimated at $49,687, approximately $39 per square foot. 309 S Broad St SW is a home located in Floyd County with nearby schools including Dan McCarty Middle School, Rome High School, and Darlington School.
Ownership History
Date
Name
Owned For
Owner Type
Purchase Details
Closed on
Jun 6, 2024
Sold by
Potts Herbert L
Bought by
Potts Herbert L
Current Estimated Value
Purchase Details
Closed on
Feb 9, 2024
Sold by
Copeland Jackie Ray
Bought by
Potts Herbert
Purchase Details
Closed on
Dec 28, 2023
Sold by
Barnes Regina Powell Tr
Bought by
Copeland Jackie Ray
Purchase Details
Closed on
Feb 29, 2008
Sold by
Not Provided
Bought by
Copeland Jackie Ray
Purchase Details
Closed on
Jul 30, 2002
Sold by
Powell Bobbie Jean
Bought by
Orellana Jose M
Purchase Details
Closed on
Jun 17, 1991
Sold by
Powell Charlie H
Bought by
Powell Bobbie Jean
Purchase Details
Closed on
Dec 3, 1973
Sold by
White Robert Lee
Bought by
Powell Charlie H
Purchase Details
Closed on
Jan 2, 1901
Sold by
Cox R P Est
Bought by
Trust Co Of Ga Trustee Catherine Cox Smi
Purchase Details
Closed on
Jan 1, 1901
Bought by
Cox R P Est
Create a Home Valuation Report for This Property
The Home Valuation Report is an in-depth analysis detailing your home's value as well as a comparison with similar homes in the area
Home Values in the Area
Average Home Value in this Area
Purchase History
| Date | Buyer | Sale Price | Title Company |
|---|---|---|---|
| Potts Herbert L | -- | -- | |
| Potts Herbert | $42,500 | -- | |
| Copeland Jackie Ray | -- | -- | |
| Copeland Jackie Ray | $42,500 | -- | |
| Copeland Jackie Ray | $42,500 | -- | |
| Orellana Jose M | $20,000 | -- | |
| Powell Bobbie Jean | -- | -- | |
| Powell Charlie H | $8,500 | -- | |
| White Robert Lee | $8,000 | -- | |
| Trust Co Of Ga Trustee Catherine Cox Smi | -- | -- | |
| Cox R P Est | -- | -- |
Source: Public Records
Tax History Compared to Growth
Tax History
| Year | Tax Paid | Tax Assessment Tax Assessment Total Assessment is a certain percentage of the fair market value that is determined by local assessors to be the total taxable value of land and additions on the property. | Land | Improvement |
|---|---|---|---|---|
| 2024 | $625 | $17,404 | $7,942 | $9,462 |
| 2023 | $616 | $17,354 | $7,942 | $9,412 |
| 2022 | $607 | $16,632 | $7,220 | $9,412 |
| 2021 | $617 | $16,622 | $7,220 | $9,402 |
| 2020 | $622 | $16,622 | $7,220 | $9,402 |
| 2019 | $615 | $16,622 | $7,220 | $9,402 |
| 2018 | $615 | $16,622 | $7,220 | $9,402 |
| 2017 | $615 | $16,622 | $7,220 | $9,402 |
| 2016 | $617 | $16,604 | $7,200 | $9,404 |
| 2015 | $582 | $16,604 | $7,200 | $9,404 |
| 2014 | $582 | $16,604 | $7,200 | $9,404 |
Source: Public Records
Map
Nearby Homes
- 232 S Broad St SW
- 515 S Broad St SW
- 115 Lookout Cir SW
- 105 Mary St SW
- 113 Lookout Cir SW
- 107 Butler St SW
- 111 Lookout Cir SW
- 110 Cherokee St SW
- 515 Harper Ave SW
- 235 Pennington Ave SW
- 3 Grover St SW
- 334 Branham Ave SW
- 410 Hardy Ave SW
- 515 Hardy Ave SW
- 529 Branham Ave SW
- 3 Porter St SW
- 13 N Blanche Ave SW
- 5 Jervis St SW
- 307 S Broad St SW Unit 307-311
- 307 S Broad St SW
- 101 E Forest St SW
- 400 S Broad St SW
- 403 S Broad St SW
- 102 E Forest St SW
- 0 Southern Street Apartments Unit 3609156-11662578
- 0 Southern Street Apartments Unit 3609156-6399595
- 0 Southern Street Apartments Unit 3609156-7815297
- 402 S Broad St SW
- 106 Etowah Terrace SW
- 104 Etowah Terrace SW
- 104 Forsyth St NE
- 104 Forsyth St NE
- 405 S Broad St SW
- 0 McGee Bend Rd Unit TR 12 & 13 7066546
- 100 Etowah Terrace SW
- 6 W Forest St SW
- 98 Etowah Terrace SW
- 8 W Forest St SW