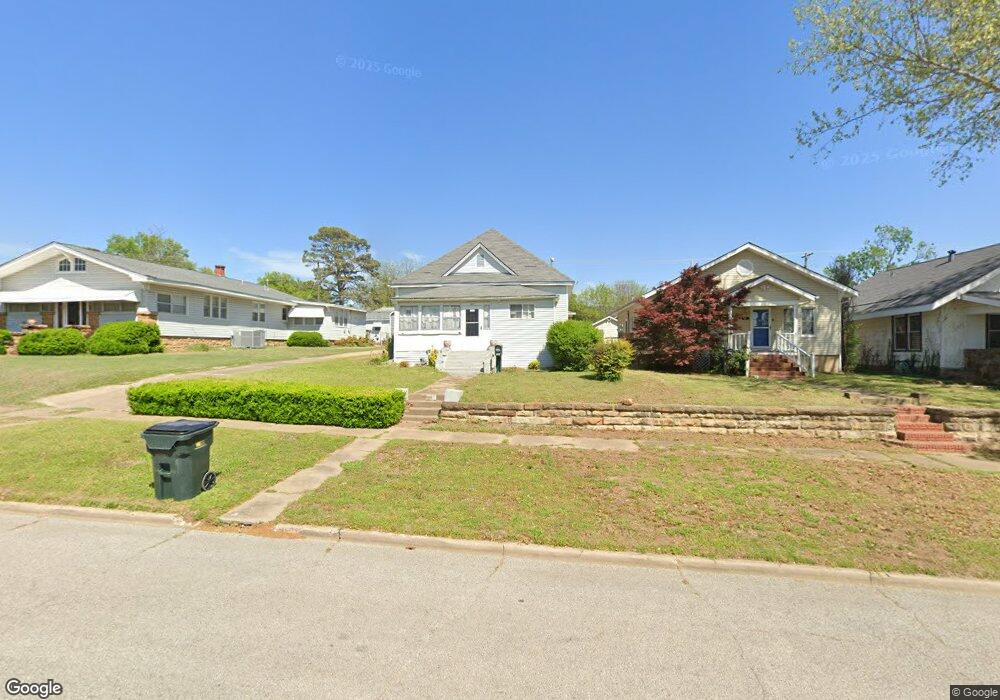
309 S Elm St Sapulpa, OK 74066
Estimated Value: $124,000 - $179,000
2
Beds
2
Baths
1,213
Sq Ft
$121/Sq Ft
Est. Value
About This Home
This home is located at 309 S Elm St, Sapulpa, OK 74066 and is currently estimated at $146,627, approximately $120 per square foot. 309 S Elm St is a home located in Creek County with nearby schools including Sapulpa Junior High School, Sapulpa Middle School, and Sapulpa High School.
Ownership History
Date
Name
Owned For
Owner Type
Purchase Details
Closed on
Nov 17, 2011
Sold by
Secretary Of Housing And Urban Developme
Bought by
Kinkade Margaret
Current Estimated Value
Purchase Details
Closed on
Sep 6, 2011
Sold by
Campbell Scott E and Campbell Melissa M
Bought by
Mortgage Clearing Corporation
Purchase Details
Closed on
Jun 12, 2009
Sold by
Campbell Scott E and Campbell Melissa M
Bought by
Campbell Scott E
Home Financials for this Owner
Home Financials are based on the most recent Mortgage that was taken out on this home.
Original Mortgage
$95,004
Interest Rate
4.83%
Mortgage Type
FHA
Purchase Details
Closed on
Sep 20, 2006
Sold by
Bezanson Michael C and Bezanson Sanam M
Bought by
Campbell Scott E and Miller Jeffrey D
Home Financials for this Owner
Home Financials are based on the most recent Mortgage that was taken out on this home.
Original Mortgage
$94,242
Interest Rate
6.51%
Mortgage Type
Credit Line Revolving
Create a Home Valuation Report for This Property
The Home Valuation Report is an in-depth analysis detailing your home's value as well as a comparison with similar homes in the area
Home Values in the Area
Average Home Value in this Area
Purchase History
| Date | Buyer | Sale Price | Title Company |
|---|---|---|---|
| Kinkade Margaret | -- | -- | |
| Mortgage Clearing Corporation | $72,000 | None Available | |
| Campbell Scott E | -- | -- | |
| Campbell Scott E | $95,000 | None Available |
Source: Public Records
Mortgage History
| Date | Status | Borrower | Loan Amount |
|---|---|---|---|
| Previous Owner | Campbell Scott E | $95,004 | |
| Previous Owner | Campbell Scott E | $94,242 |
Source: Public Records
Tax History Compared to Growth
Tax History
| Year | Tax Paid | Tax Assessment Tax Assessment Total Assessment is a certain percentage of the fair market value that is determined by local assessors to be the total taxable value of land and additions on the property. | Land | Improvement |
|---|---|---|---|---|
| 2025 | $557 | $6,580 | $998 | $5,582 |
| 2024 | $557 | $6,581 | $934 | $5,647 |
| 2023 | $557 | $6,581 | $1,034 | $5,547 |
| 2022 | $526 | $6,581 | $1,089 | $5,492 |
| 2021 | $543 | $6,581 | $1,483 | $5,098 |
| 2020 | $540 | $6,581 | $1,477 | $5,104 |
| 2019 | $543 | $6,581 | $1,463 | $5,118 |
| 2018 | $554 | $6,581 | $1,729 | $4,852 |
| 2017 | $551 | $6,581 | $1,729 | $4,852 |
| 2016 | $524 | $6,581 | $1,729 | $4,852 |
| 2015 | -- | $6,581 | $1,729 | $4,852 |
| 2014 | -- | $6,581 | $1,740 | $4,841 |
Source: Public Records
Map
Nearby Homes
- 320 E Mckinley Ave
- 507 S Park St
- 415 S Walnut St
- 210 S Water St
- 612 S Park St
- 511 S Maple St
- 317 S Poplar St
- 706 E Thompson Ave
- 111 S Poplar St
- 314 S Poplar St
- 410 S Poplar St
- 609 S Poplar St
- 702 S Main St
- 206 S Mounds St
- 724 S Main St
- 303 W Mckinley Ave
- 637 S Mounds St
- 14 S Mounds St
- 706 S Poplar St
- 310 W Lee Ave