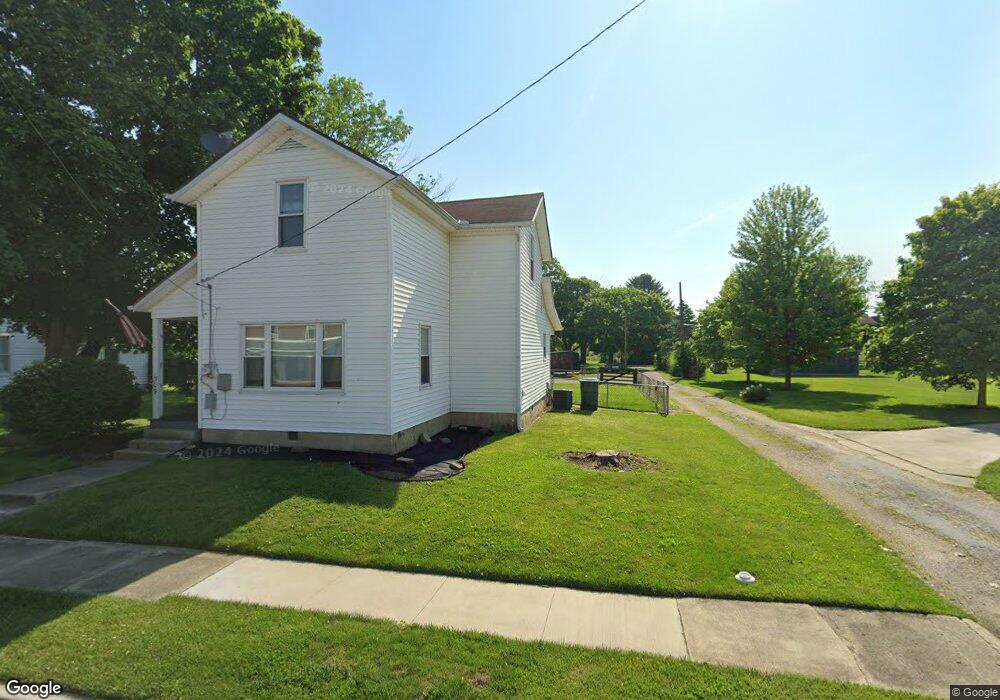
309 S Jefferson St Pitsburg, OH 45358
Estimated Value: $160,000 - $184,954
3
Beds
2
Baths
1,448
Sq Ft
$121/Sq Ft
Est. Value
About This Home
This home is located at 309 S Jefferson St, Pitsburg, OH 45358 and is currently estimated at $174,739, approximately $120 per square foot. 309 S Jefferson St is a home located in Darke County with nearby schools including Franklin Monroe Elementary School and Franklin Monroe High School.
Ownership History
Date
Name
Owned For
Owner Type
Purchase Details
Closed on
Mar 30, 2023
Sold by
Bridenbaugh Jeremy and Bridenbaugh Morgan
Bought by
Collins Trevor J and Hackney Taylor L
Current Estimated Value
Home Financials for this Owner
Home Financials are based on the most recent Mortgage that was taken out on this home.
Original Mortgage
$140,000
Outstanding Balance
$136,037
Interest Rate
6.5%
Mortgage Type
Construction
Estimated Equity
$38,702
Purchase Details
Closed on
Apr 13, 2021
Sold by
Booher Timothy J and Booher Sandra R
Bought by
Bridenbaugh Jeremy and Bridenbaugh Morgan
Home Financials for this Owner
Home Financials are based on the most recent Mortgage that was taken out on this home.
Original Mortgage
$105,000
Interest Rate
3.05%
Mortgage Type
New Conventional
Purchase Details
Closed on
Jun 8, 2020
Sold by
Booher Chad W and Booher Amy M
Bought by
Booher Timothy J and Booher Sandra R
Purchase Details
Closed on
Dec 2, 2019
Sold by
Mong Tal A and Mong Tracy A
Bought by
Booher Chad W and Booher Amy M
Purchase Details
Closed on
Sep 10, 2008
Sold by
Estate Of Jack A Mong
Bought by
Mong Patty L
Purchase Details
Closed on
Oct 1, 1987
Bought by
Mong Patty L
Create a Home Valuation Report for This Property
The Home Valuation Report is an in-depth analysis detailing your home's value as well as a comparison with similar homes in the area
Home Values in the Area
Average Home Value in this Area
Purchase History
| Date | Buyer | Sale Price | Title Company |
|---|---|---|---|
| Collins Trevor J | $148,000 | None Listed On Document | |
| Bridenbaugh Jeremy | $125,000 | None Available | |
| Booher Timothy J | $125,000 | None Available | |
| Booher Chad W | $50,000 | None Available | |
| Mong Patty L | -- | None Available | |
| Mong Patty L | $40,000 | -- |
Source: Public Records
Mortgage History
| Date | Status | Borrower | Loan Amount |
|---|---|---|---|
| Open | Collins Trevor J | $140,000 | |
| Previous Owner | Bridenbaugh Jeremy | $105,000 |
Source: Public Records
Tax History Compared to Growth
Tax History
| Year | Tax Paid | Tax Assessment Tax Assessment Total Assessment is a certain percentage of the fair market value that is determined by local assessors to be the total taxable value of land and additions on the property. | Land | Improvement |
|---|---|---|---|---|
| 2024 | $2,209 | $48,440 | $3,680 | $44,760 |
| 2023 | $1,996 | $42,540 | $3,680 | $38,860 |
| 2022 | $2,129 | $40,250 | $3,070 | $37,180 |
| 2021 | $2,144 | $40,250 | $3,070 | $37,180 |
| 2020 | $1,527 | $26,060 | $3,070 | $22,990 |
| 2019 | $1,406 | $23,600 | $3,070 | $20,530 |
| 2018 | $1,487 | $23,600 | $3,070 | $20,530 |
| 2017 | $1,198 | $23,600 | $3,070 | $20,530 |
| 2016 | $1,204 | $19,230 | $3,090 | $16,140 |
| 2015 | $1,204 | $19,230 | $3,090 | $16,140 |
| 2014 | $1,208 | $19,230 | $3,090 | $16,140 |
| 2013 | $1,216 | $17,760 | $3,090 | $14,670 |
Source: Public Records
Map
Nearby Homes
- 107 Merrie Ln
- 8784 Grubbs Rex Rd
- 1486 Ohio 49
- 0 Delisle Fourman Rd
- 6977 Alternate State Route 49
- 303 E 1st St
- 9 Seminole Ln
- 11863 Hall Rd
- 5 Seminole Ln
- Oh-722
- 8988 State Route 571
- Alt St Rt 49 Alt State Route 49
- 210 W South St
- 2 Edgewood Dr
- 8 Parkdale Dr
- 404 W 1st St
- 406 W South St
- 22 Greenmoor Dr
- 604 W North St
- 9 Harvest Dr
- 301 S Jefferson St
- 301 N Jefferson St
- 321 S Jefferson St
- 316 S Jefferson St
- 300 Harrison St
- 227 S Jefferson St
- 322 S Jefferson St
- 70 E Brown St
- 221 S Jefferson St
- 221 Jefferson St
- 300 S Jefferson St
- 320 S Jefferson St
- 400 Harrison St
- 220 S Jefferson St
- 401 Jefferson St
- 211 S Jefferson St
- 301 Harrison St
- 400 S Jefferson St
- 210 S Jefferson St
- 227 Harrison St