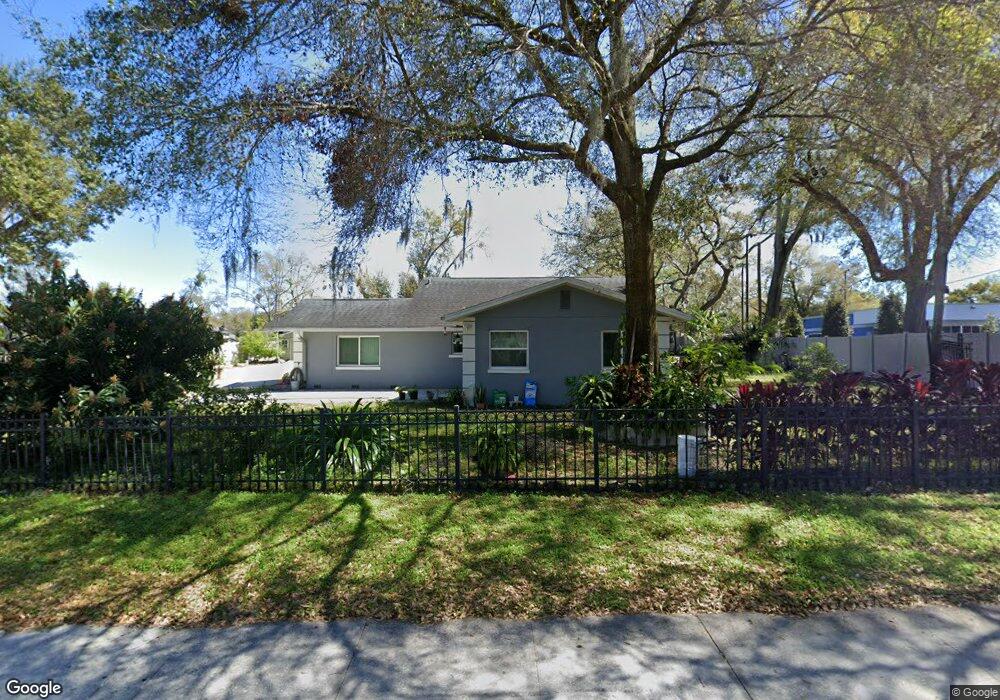
309 S Thompson Rd Apopka, FL 32703
Estimated Value: $248,000 - $311,000
3
Beds
2
Baths
1,597
Sq Ft
$171/Sq Ft
Est. Value
About This Home
This home is located at 309 S Thompson Rd, Apopka, FL 32703 and is currently estimated at $272,797, approximately $170 per square foot. 309 S Thompson Rd is a home located in Orange County with nearby schools including Lovell Elementary School, Piedmont Lakes Middle School, and Wekiva High School.
Ownership History
Date
Name
Owned For
Owner Type
Purchase Details
Closed on
Nov 25, 2019
Sold by
Gonzalez Ramiro
Bought by
Zayago Ecerra Jairo and Rios Margarito Zayago
Current Estimated Value
Purchase Details
Closed on
Dec 23, 2014
Sold by
Christiana Trust
Bought by
Gonzalez Ramiro
Home Financials for this Owner
Home Financials are based on the most recent Mortgage that was taken out on this home.
Original Mortgage
$72,000
Interest Rate
4.04%
Mortgage Type
New Conventional
Purchase Details
Closed on
Aug 13, 2014
Sold by
Debitetto Jeffrey and Debitetto Tess
Bought by
Christina Trust
Purchase Details
Closed on
Aug 1, 2007
Sold by
Hamlin Joanna and Hamlin Edward Landon
Bought by
Debitetto Jeffrey and Debitetto Tess
Home Financials for this Owner
Home Financials are based on the most recent Mortgage that was taken out on this home.
Original Mortgage
$139,500
Interest Rate
8.25%
Mortgage Type
Purchase Money Mortgage
Create a Home Valuation Report for This Property
The Home Valuation Report is an in-depth analysis detailing your home's value as well as a comparison with similar homes in the area
Home Values in the Area
Average Home Value in this Area
Purchase History
| Date | Buyer | Sale Price | Title Company |
|---|---|---|---|
| Zayago Ecerra Jairo | -- | None Available | |
| Gonzalez Ramiro | $94,900 | Shore To Shore Title Llc | |
| Christina Trust | $600 | None Available | |
| Debitetto Jeffrey | $155,000 | None Available |
Source: Public Records
Mortgage History
| Date | Status | Borrower | Loan Amount |
|---|---|---|---|
| Previous Owner | Gonzalez Ramiro | $72,000 | |
| Previous Owner | Debitetto Jeffrey | $139,500 |
Source: Public Records
Tax History
| Year | Tax Paid | Tax Assessment Tax Assessment Total Assessment is a certain percentage of the fair market value that is determined by local assessors to be the total taxable value of land and additions on the property. | Land | Improvement |
|---|---|---|---|---|
| 2025 | $2,725 | $140,744 | -- | -- |
| 2024 | $2,235 | $127,949 | -- | -- |
| 2023 | $2,235 | $154,043 | $80,000 | $74,043 |
| 2022 | $1,934 | $124,381 | $60,000 | $64,381 |
| 2021 | $1,632 | $87,391 | $30,000 | $57,391 |
| 2020 | $1,590 | $88,537 | $30,000 | $58,537 |
| 2019 | $1,684 | $89,683 | $30,000 | $59,683 |
| 2018 | $1,680 | $88,336 | $30,000 | $58,336 |
| 2017 | $1,641 | $87,492 | $30,000 | $57,492 |
| 2016 | $1,496 | $76,402 | $20,000 | $56,402 |
| 2015 | $1,488 | $74,101 | $20,000 | $54,101 |
| 2014 | $1,505 | $71,971 | $28,970 | $43,001 |
Source: Public Records
Map
Nearby Homes
- 378 Thompson Rd
- 1005 Love Ln Unit 25
- 1011 Love Ln Unit 31
- 0 Sand Ave Unit MFRS5138566
- 0 Sand Ave Unit MFRO6346601
- 494 Thompson Village Ave
- 462 Thompson Village Ave
- 454 Thompson Village Ave
- 450 Thompson Village Ave
- 475 Thompson Village Ave
- 642 S Orange Blossom Trail
- 1003 E 10th St
- 991 E 10th St
- 1240 E Votaw Rd
- 1402 Rolling Green Dr
- 1614 Wekiva Crossing Blvd
- 1533 Sunset View Cir
- 352 Sesame Ave
- 453 Dominish Estates Dr
- 103 N Cervidae Dr
- 239 S Thompson Rd
- 232 S Thompson Rd
- 274 Thompson Rd
- 310 S Thompson Rd
- 226 S Thompson Rd
- 1220 Dovehill Dr
- 1224 Dovehill Dr
- 258 Dovetail Ct
- 254 Dovetail Ct
- 1228 Dovehill Dr
- 250 Dovetail Ct
- 1232 Dovehill Dr
- 246 Dovetail Ct
- 222 S Thompson Rd
- 316 S Thompson Rd
- 242 Dovetail Ct
- 238 Dovetail Ct
- 1236 Dovehill Dr Unit 1244
- 1240 Dovehill Dr
- 259 Dovetail Ct
Your Personal Tour Guide
Ask me questions while you tour the home.