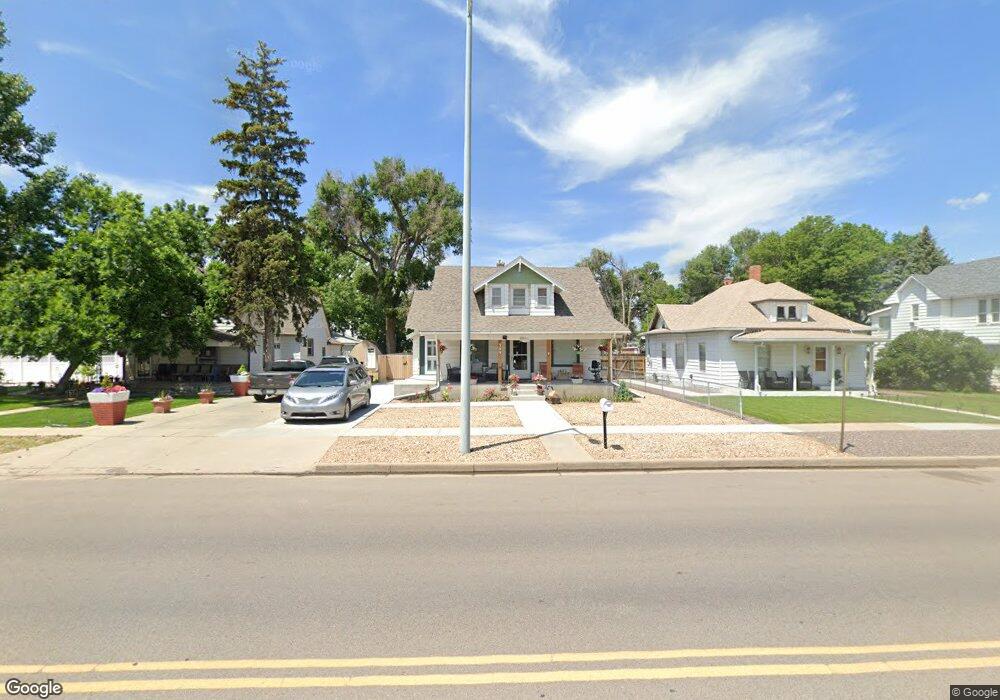
309 Sherman St Fort Morgan, CO 80701
Estimated Value: $298,000 - $405,000
4
Beds
2
Baths
2,771
Sq Ft
$120/Sq Ft
Est. Value
About This Home
This home is located at 309 Sherman St, Fort Morgan, CO 80701 and is currently estimated at $331,737, approximately $119 per square foot. 309 Sherman St is a home located in Morgan County with nearby schools including Fort Morgan High School, Trinity Lutheran School, and Lighthouse Seventh-day Adventist Christian School.
Ownership History
Date
Name
Owned For
Owner Type
Purchase Details
Closed on
Oct 13, 2021
Sold by
Wihelmson Evelina
Bought by
Wilheims Robert B and Calces Wilhelmson Evelina
Current Estimated Value
Home Financials for this Owner
Home Financials are based on the most recent Mortgage that was taken out on this home.
Original Mortgage
$208,000
Outstanding Balance
$189,677
Interest Rate
2.8%
Mortgage Type
New Conventional
Estimated Equity
$142,060
Create a Home Valuation Report for This Property
The Home Valuation Report is an in-depth analysis detailing your home's value as well as a comparison with similar homes in the area
Home Values in the Area
Average Home Value in this Area
Purchase History
| Date | Buyer | Sale Price | Title Company |
|---|---|---|---|
| Wilheims Robert B | -- | First American |
Source: Public Records
Mortgage History
| Date | Status | Borrower | Loan Amount |
|---|---|---|---|
| Open | Wilheims Robert B | $208,000 |
Source: Public Records
Tax History Compared to Growth
Tax History
| Year | Tax Paid | Tax Assessment Tax Assessment Total Assessment is a certain percentage of the fair market value that is determined by local assessors to be the total taxable value of land and additions on the property. | Land | Improvement |
|---|---|---|---|---|
| 2024 | $1,379 | $17,220 | $2,580 | $14,640 |
| 2023 | $1,379 | $20,910 | $3,130 | $17,780 |
| 2022 | $1,459 | $17,800 | $3,060 | $14,740 |
| 2021 | $1,503 | $18,320 | $3,150 | $15,170 |
| 2020 | $1,311 | $15,550 | $3,000 | $12,550 |
| 2019 | $1,313 | $15,550 | $3,000 | $12,550 |
| 2018 | $967 | $11,290 | $2,420 | $8,870 |
| 2017 | $969 | $11,290 | $2,420 | $8,870 |
| 2016 | $909 | $10,500 | $2,090 | $8,410 |
| 2015 | $896 | $10,500 | $2,090 | $8,410 |
| 2014 | $815 | $9,310 | $1,670 | $7,640 |
| 2013 | -- | $9,310 | $1,670 | $7,640 |
Source: Public Records
Map
Nearby Homes