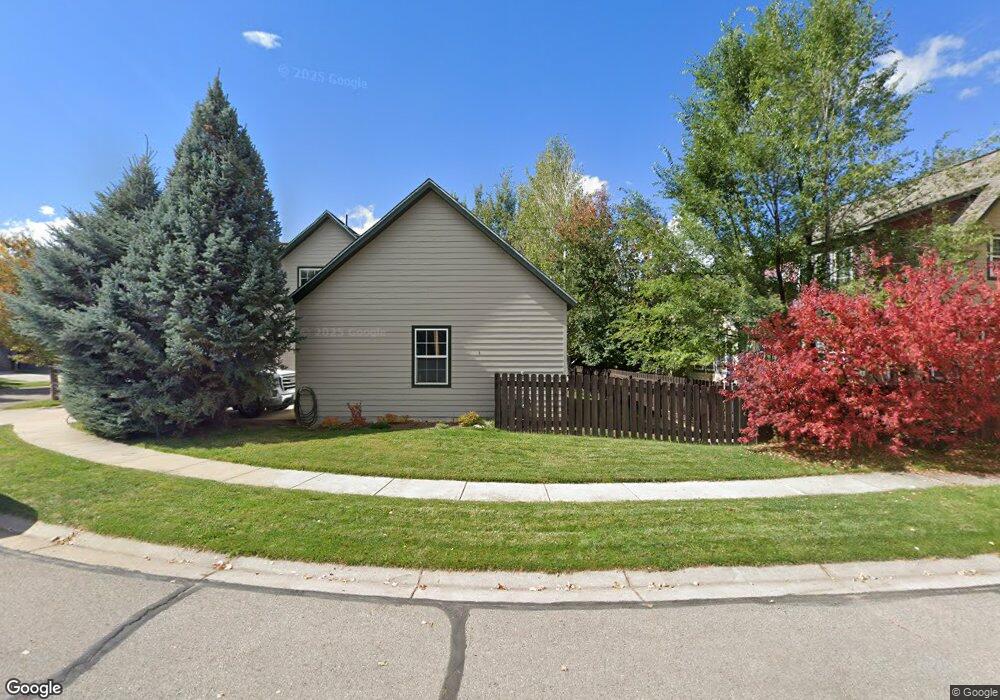
309 Sopris Cir Basalt, CO 81621
Estimated Value: $2,594,668 - $3,675,000
3
Beds
3
Baths
3,073
Sq Ft
$986/Sq Ft
Est. Value
About This Home
This home is located at 309 Sopris Cir, Basalt, CO 81621 and is currently estimated at $3,030,167, approximately $986 per square foot. 309 Sopris Cir is a home located in Eagle County with nearby schools including Waldorf School on the Roaring Fork and Cornerstone Classical School.
Ownership History
Date
Name
Owned For
Owner Type
Purchase Details
Closed on
Jul 7, 2022
Sold by
Bethany Card
Bought by
Gallagher Rollin M and Gallagher Emily R
Current Estimated Value
Purchase Details
Closed on
Dec 2, 2013
Sold by
Franklin John C
Bought by
Card Bethany and Peterson Kai
Purchase Details
Closed on
Jun 24, 2011
Sold by
Trucap Reo Corp
Bought by
Card Bethany and Peterson Kai
Purchase Details
Closed on
Dec 1, 2010
Sold by
Wells Fargo Bank Na
Bought by
Trucap Reo Corp
Purchase Details
Closed on
Nov 3, 2010
Sold by
Dupps Ralph L and Dupps Katherine
Bought by
Wells Fargo Bank Na
Purchase Details
Closed on
Mar 14, 2008
Sold by
Seguin William
Bought by
Dupps Katherine and Dupps Ralph L
Home Financials for this Owner
Home Financials are based on the most recent Mortgage that was taken out on this home.
Original Mortgage
$840,000
Interest Rate
5.62%
Mortgage Type
Purchase Money Mortgage
Purchase Details
Closed on
Nov 30, 1995
Purchase Details
Closed on
Oct 30, 1995
Create a Home Valuation Report for This Property
The Home Valuation Report is an in-depth analysis detailing your home's value as well as a comparison with similar homes in the area
Home Values in the Area
Average Home Value in this Area
Purchase History
| Date | Buyer | Sale Price | Title Company |
|---|---|---|---|
| Gallagher Rollin M | $2,445,000 | New Title Company Name | |
| Card Bethany | -- | None Available | |
| Card Bethany | $300,000 | None Available | |
| Trucap Reo Corp | -- | None Available | |
| Wells Fargo Bank Na | -- | None Available | |
| Dupps Katherine | $1,050,000 | None Available | |
| -- | $219,500 | -- | |
| -- | $130,000 | -- |
Source: Public Records
Mortgage History
| Date | Status | Borrower | Loan Amount |
|---|---|---|---|
| Previous Owner | Dupps Katherine | $840,000 |
Source: Public Records
Tax History
| Year | Tax Paid | Tax Assessment Tax Assessment Total Assessment is a certain percentage of the fair market value that is determined by local assessors to be the total taxable value of land and additions on the property. | Land | Improvement |
|---|---|---|---|---|
| 2025 | $10,679 | $144,860 | $47,070 | $97,790 |
| 2024 | $10,383 | $124,330 | $23,920 | $100,410 |
| 2023 | $10,383 | $124,330 | $23,920 | $100,410 |
| 2022 | $7,570 | $82,510 | $25,550 | $56,960 |
| 2021 | $7,294 | $78,320 | $26,280 | $52,040 |
| 2020 | $5,329 | $59,340 | $21,790 | $37,550 |
| 2019 | $6,673 | $73,440 | $21,790 | $51,650 |
| 2018 | $6,530 | $70,840 | $21,950 | $48,890 |
| 2017 | $3,730 | $42,310 | $21,950 | $20,360 |
| 2016 | $3,480 | $38,890 | $22,120 | $16,770 |
| 2015 | -- | $38,890 | $22,120 | $16,770 |
| 2014 | $2,638 | $31,320 | $21,410 | $9,910 |
Source: Public Records
Map
Nearby Homes
- 432 Meadow Ct
- 410 Meadow Ct
- 548 Evans Ct
- 541 Evans Ct
- 634 Evans Ct
- 212 Juniper Ct
- 129 Valley Ct
- 104 Evans Rd Unit 207
- 113 Valley Ct
- 103 Willow Rd Unit 106
- 103 Willow Rd Unit 205
- 103 Willow Rd Unit 101
- 103 Willow Rd Unit 105
- 103 Willow Rd Unit 103
- 103 Willow Rd Unit 204
- 103 Willow Rd Unit 107
- 103 Willow Rd Unit 207
- 103 Willow Rd Unit 203
- 103 Willow Rd Unit 206
- 103 Willow Rd Unit 201
Your Personal Tour Guide
Ask me questions while you tour the home.