Estimated Value: $373,505 - $404,000
4
Beds
3
Baths
2,573
Sq Ft
$152/Sq Ft
Est. Value
About This Home
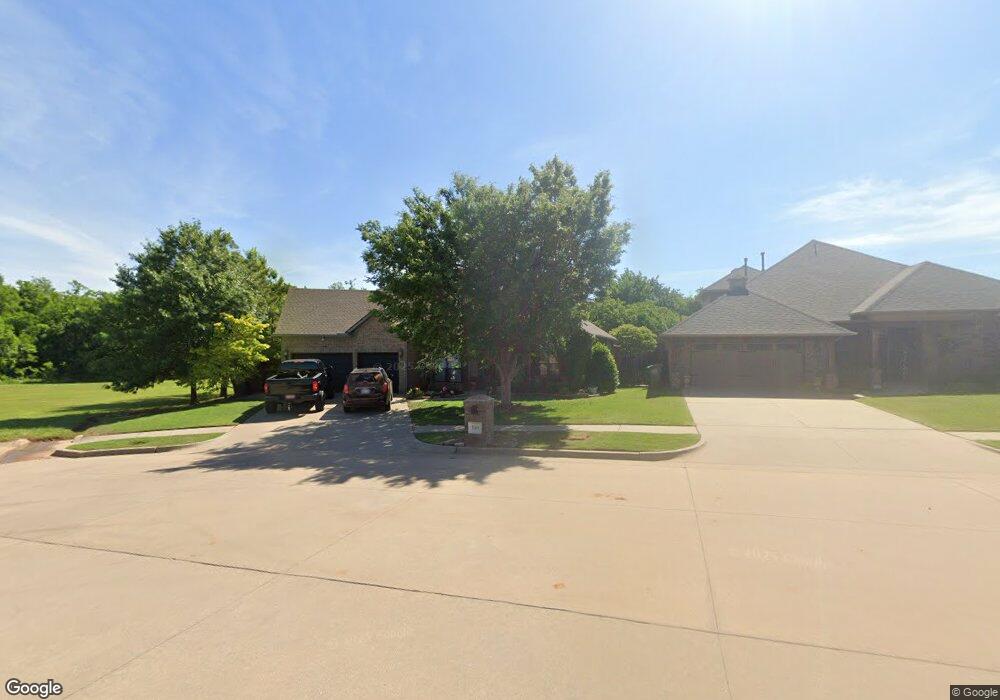
This home is located at 309 Swingman Ct, Yukon, OK 73099 and is currently estimated at $392,376, approximately $152 per square foot. 309 Swingman Ct is a home located in Canadian County with nearby schools including Banner School and St. John Nepomuk Catholic School.
Ownership History
Date
Name
Owned For
Owner Type
Purchase Details
Closed on
Jul 7, 2020
Sold by
Christy Justin W and Christy Kathleen J
Bought by
Wedman Shannon Ashley and Wedman Christopher G
Current Estimated Value
Home Financials for this Owner
Home Financials are based on the most recent Mortgage that was taken out on this home.
Original Mortgage
$218,325
Outstanding Balance
$30,013
Interest Rate
3.2%
Mortgage Type
Future Advance Clause Open End Mortgage
Estimated Equity
$362,363
Purchase Details
Closed on
May 7, 2010
Sold by
Valliance Bank
Bought by
Christy Justin W
Purchase Details
Closed on
Sep 27, 2006
Sold by
Lone Oak Ridge Llc
Bought by
Brass Birck Homes Inc
Home Financials for this Owner
Home Financials are based on the most recent Mortgage that was taken out on this home.
Original Mortgage
$221,200
Interest Rate
6.44%
Mortgage Type
Purchase Money Mortgage
Create a Home Valuation Report for This Property
The Home Valuation Report is an in-depth analysis detailing your home's value as well as a comparison with similar homes in the area
Home Values in the Area
Average Home Value in this Area
Purchase History
| Date | Buyer | Sale Price | Title Company |
|---|---|---|---|
| Wedman Shannon Ashley | $295,000 | Old Republic Title | |
| Christy Justin W | $235,000 | Fatco | |
| Brass Birck Homes Inc | $33,375 | None Available |
Source: Public Records
Mortgage History
| Date | Status | Borrower | Loan Amount |
|---|---|---|---|
| Open | Wedman Shannon Ashley | $218,325 | |
| Previous Owner | Brass Birck Homes Inc | $221,200 |
Source: Public Records
Tax History Compared to Growth
Tax History
| Year | Tax Paid | Tax Assessment Tax Assessment Total Assessment is a certain percentage of the fair market value that is determined by local assessors to be the total taxable value of land and additions on the property. | Land | Improvement |
|---|---|---|---|---|
| 2024 | $2,543 | $34,188 | $5,280 | $28,908 |
| 2023 | $2,543 | $33,192 | $5,280 | $27,912 |
| 2022 | $2,501 | $32,225 | $5,280 | $26,945 |
| 2021 | $2,452 | $31,356 | $5,280 | $26,076 |
| 2020 | $2,432 | $31,356 | $5,280 | $26,076 |
| 2019 | $2,383 | $30,473 | $5,280 | $25,193 |
| 2018 | $2,352 | $29,585 | $5,280 | $24,305 |
| 2017 | $2,378 | $29,585 | $5,280 | $24,305 |
| 2016 | $2,381 | $30,209 | $5,280 | $24,929 |
| 2015 | $2,268 | $29,761 | $5,340 | $24,421 |
| 2014 | $2,268 | $29,287 | $5,340 | $23,947 |
Source: Public Records
Map
Nearby Homes
- 409 Frisco Ridge Rd
- 0 U S Route 66
- 1913 Tinder St
- 632 Signalman
- 613 Side Track Rd
- Holloway Plan at Magnolia Harbor
- Forrester Plan at Magnolia Harbor
- Inwood - Canvas Collection Plan at Magnolia Harbor
- Frederickson Plan at Magnolia Harbor
- Chadwick Plan at Magnolia Harbor
- 1101 W Main St
- 1016 Maple Ave
- 417 Garth Brooks Blvd
- 1004 Cedar Ave
- 611 Garth Brooks Blvd
- 9116 Anaum Ln
- 624 Frisco Ridge Rd
- 11325 SW 34th Terrace
- 600 S 8th St
- 705 Yukon Ave
- 313 Swingman Ct
- 301 Swingman Ct
- 317 Swingman Ct
- 405 Branch Line Rd
- 300 Swingman Ct
- 1901 Branch Line Rd
- 304 Swingman Ct
- 1905 Branch Line Rd
- 409 Branch Line Rd
- 401 Swingman Rd
- 1909 Branch Line Rd
- 400 Swingman Rd
- 405 Swingman Rd
- 417 Branch Line Rd
- 404 Swingman Rd
- 401 Frisco Ridge Rd
- 409 Swingman Rd
- 409 Swingman Rd
- 408 Swingman Rd
- 421 Branch Line Rd