Estimated Value: $248,000 - $308,000
5
Beds
3
Baths
1,936
Sq Ft
$144/Sq Ft
Est. Value
About This Home
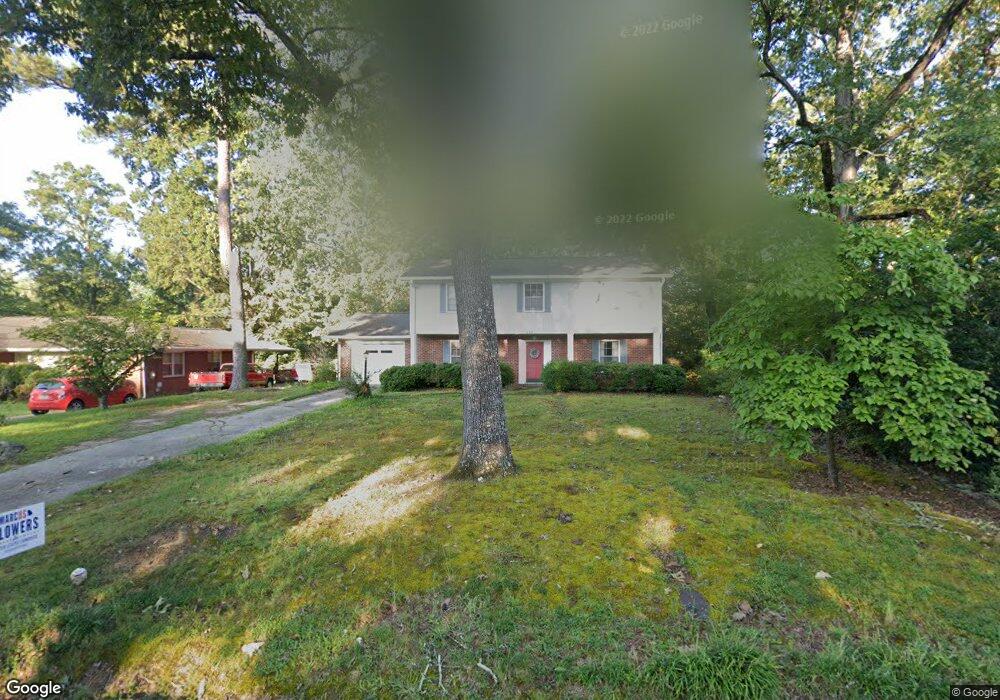
This home is located at 309 Timothy Ave NW, Rome, GA 30165 and is currently estimated at $279,714, approximately $144 per square foot. 309 Timothy Ave NW is a home located in Floyd County with nearby schools including Rome High School and Unity Christian School.
Ownership History
Date
Name
Owned For
Owner Type
Purchase Details
Closed on
Jul 24, 2020
Sold by
Johnson Steven Michael
Bought by
Nobles Carolyn
Current Estimated Value
Purchase Details
Closed on
Apr 4, 2005
Sold by
Johnson Jean Mccollum
Bought by
Johnson Steven Michael and Johnson Christopher Joseph
Purchase Details
Closed on
Jul 12, 2002
Sold by
Johnson Billy Joe
Bought by
Johnson Billy Joe and Jean Mccollum J
Purchase Details
Closed on
Aug 1, 1977
Sold by
Lindsey Lindsey S and Lindsey Yvonne M
Bought by
Johnson Billy Joe
Purchase Details
Closed on
Jun 9, 1975
Sold by
Masters Wayne A
Bought by
Lindsey Lindsey S and Lindsey Yvonne M
Purchase Details
Closed on
May 1, 1973
Sold by
Day Fred
Bought by
Masters Wayne A
Purchase Details
Closed on
Dec 8, 1965
Sold by
Clyde Davis B
Bought by
Day Fred
Purchase Details
Closed on
Aug 31, 1965
Sold by
Chandler Amon W
Bought by
Clyde Davis B
Purchase Details
Closed on
Jan 1, 1901
Bought by
Chandler Amon W
Create a Home Valuation Report for This Property
The Home Valuation Report is an in-depth analysis detailing your home's value as well as a comparison with similar homes in the area
Home Values in the Area
Average Home Value in this Area
Purchase History
| Date | Buyer | Sale Price | Title Company |
|---|---|---|---|
| Nobles Carolyn | $140,000 | -- | |
| Johnson Steven Michael | -- | -- | |
| Johnson Billy Joe | -- | -- | |
| Johnson Billy Joe | $44,000 | -- | |
| Lindsey Lindsey S | $39,700 | -- | |
| Masters Wayne A | $38,500 | -- | |
| Day Fred | $21,500 | -- | |
| Clyde Davis B | $4,400 | -- | |
| Chandler Amon W | -- | -- |
Source: Public Records
Tax History Compared to Growth
Tax History
| Year | Tax Paid | Tax Assessment Tax Assessment Total Assessment is a certain percentage of the fair market value that is determined by local assessors to be the total taxable value of land and additions on the property. | Land | Improvement |
|---|---|---|---|---|
| 2024 | $3,238 | $115,519 | $16,306 | $99,213 |
| 2023 | $2,852 | $94,748 | $14,824 | $79,924 |
| 2022 | $2,668 | $78,115 | $12,230 | $65,885 |
| 2021 | $2,029 | $71,096 | $12,230 | $58,866 |
| 2020 | $949 | $64,621 | $9,265 | $55,356 |
| 2019 | $931 | $57,888 | $9,265 | $48,623 |
| 2018 | $931 | $54,563 | $9,265 | $45,298 |
| 2017 | $931 | $52,597 | $9,265 | $43,332 |
| 2016 | $937 | $51,212 | $9,240 | $41,972 |
| 2015 | $830 | $51,212 | $9,240 | $41,972 |
| 2014 | $830 | $51,212 | $9,240 | $41,972 |
Source: Public Records
Map
Nearby Homes
- 208 Dodd St NW
- 105 Robin St NW
- 7 Raymond Ave NW
- 204 Oakwood St NW
- 614 Briarwood Cir NW
- 4 Colonial Dr NW
- 808 Charlton St NW
- 0 Unbridled Rd Unit 22 23074684
- 124 Sheridan Dr NW
- 9 Shorter Cir SW
- 209 Sherwood Rd SW
- 23 Sweetspire Dr NW
- 21 Sweetspire Dr NW
- 15 Silverbell Ln
- 1005 N 2nd Ave NW Unit 39
- PEARSON Plan at Shorter Village
- 527 W 11th St NE
- 8 S Hughes St SW
- 307 Timothy Ave NW
- 301 Redmond Rd
- 311 Redmond Rd NW
- 305 Redmond Rd NW Unit A, B
- 302 Dodd St NW
- 300 Dodd St NW
- 304 Dodd St NW
- 315 Redmond Rd
- 306 Dodd St NW
- 210 Dodd St NW
- 304 Timothy Ave NW
- 302 Timothy Ave NW
- 209 Redmond Rd NW
- 319 Redmond Rd NW
- 308 Dodd St NW
- 308 Dodd St NW
- 303 Dodd St NW
- 304 Redmond Rd NW
- 305 Dodd St NW
- 301 Dodd St NW