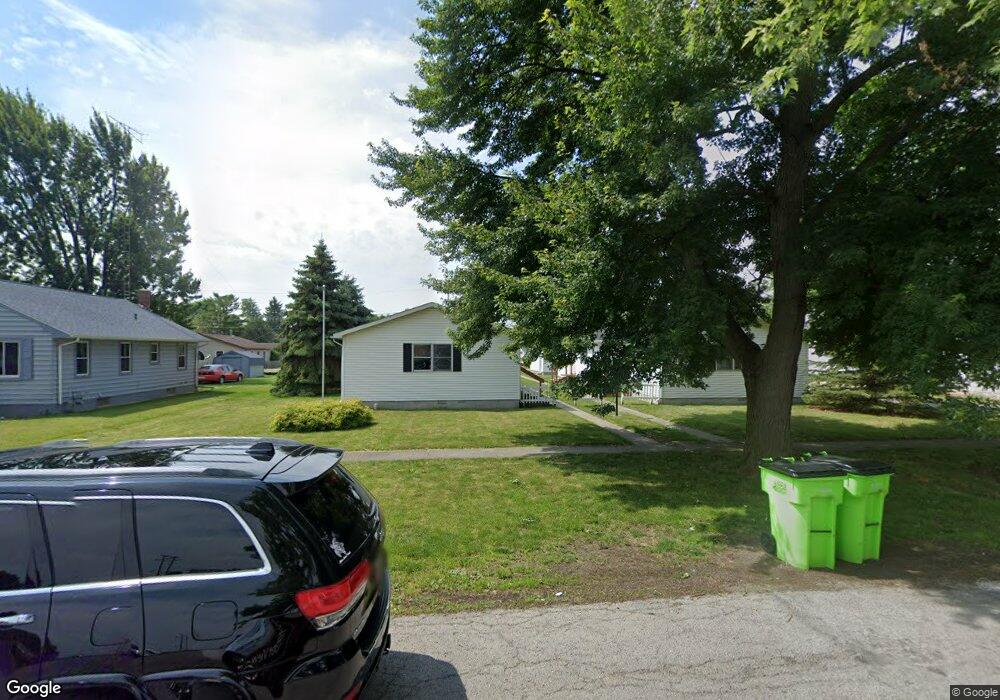
309 W 4th St Fostoria, OH 44830
Estimated Value: $65,000 - $155,991
4
Beds
2
Baths
1,608
Sq Ft
$73/Sq Ft
Est. Value
About This Home
This home is located at 309 W 4th St, Fostoria, OH 44830 and is currently estimated at $116,998, approximately $72 per square foot. 309 W 4th St is a home with nearby schools including Fostoria Intermediate Elementary School and Fostoria Junior/Senior High School.
Ownership History
Date
Name
Owned For
Owner Type
Purchase Details
Closed on
Nov 2, 2021
Sold by
Finsel Edward M and Finsel Tracie L
Bought by
Mcs Investment Group Llc
Current Estimated Value
Home Financials for this Owner
Home Financials are based on the most recent Mortgage that was taken out on this home.
Original Mortgage
$136,293
Outstanding Balance
$115,862
Interest Rate
2.88%
Mortgage Type
Future Advance Clause Open End Mortgage
Estimated Equity
$1,136
Purchase Details
Closed on
Jul 7, 2000
Sold by
Mcdonald Kenneth R
Bought by
Finsel Edward M
Purchase Details
Closed on
Jul 6, 2000
Sold by
Mcdonald Kenneth R
Bought by
Finsel Edward M
Create a Home Valuation Report for This Property
The Home Valuation Report is an in-depth analysis detailing your home's value as well as a comparison with similar homes in the area
Home Values in the Area
Average Home Value in this Area
Purchase History
| Date | Buyer | Sale Price | Title Company |
|---|---|---|---|
| Mcs Investment Group Llc | $180,000 | Flag City Title Agency | |
| Finsel Edward M | $5,300 | -- | |
| Finsel Edward M | $5,300 | -- |
Source: Public Records
Mortgage History
| Date | Status | Borrower | Loan Amount |
|---|---|---|---|
| Open | Mcs Investment Group Llc | $136,293 |
Source: Public Records
Tax History Compared to Growth
Tax History
| Year | Tax Paid | Tax Assessment Tax Assessment Total Assessment is a certain percentage of the fair market value that is determined by local assessors to be the total taxable value of land and additions on the property. | Land | Improvement |
|---|---|---|---|---|
| 2024 | $1,984 | $35,120 | $4,230 | $30,890 |
| 2023 | $1,838 | $35,120 | $4,230 | $30,890 |
| 2022 | $1,993 | $34,440 | $3,660 | $30,780 |
| 2021 | $2,036 | $34,440 | $3,660 | $30,780 |
| 2020 | $2,045 | $34,437 | $3,658 | $30,779 |
| 2019 | $1,856 | $31,024 | $3,381 | $27,643 |
| 2018 | $1,892 | $31,024 | $3,381 | $27,643 |
| 2017 | $1,730 | $31,024 | $3,381 | $27,643 |
| 2016 | $1,595 | $29,219 | $3,336 | $25,883 |
| 2015 | $1,570 | $29,219 | $3,336 | $25,883 |
| 2014 | $1,498 | $29,219 | $3,336 | $25,883 |
| 2013 | $1,744 | $31,455 | $3,626 | $27,829 |
Source: Public Records
Map
Nearby Homes
- 351 W South St
- 461 W Lytle St
- 461 W Lytle St Unit 145
- 461 W Lytle St Unit 106
- 348 W South St
- 0 W South Route 12
- 133 E South St
- 203 N Union St
- 634 W Tiffin St
- 509 College Ave
- 321 Mcdougal St
- 520 N Union St
- 412 E Center St
- 0 Bradner St
- 603 N Vine St
- 540 N Poplar St
- 723 N Union St
- 211 Summit St
- 633 Maple St
- 129 Fall St