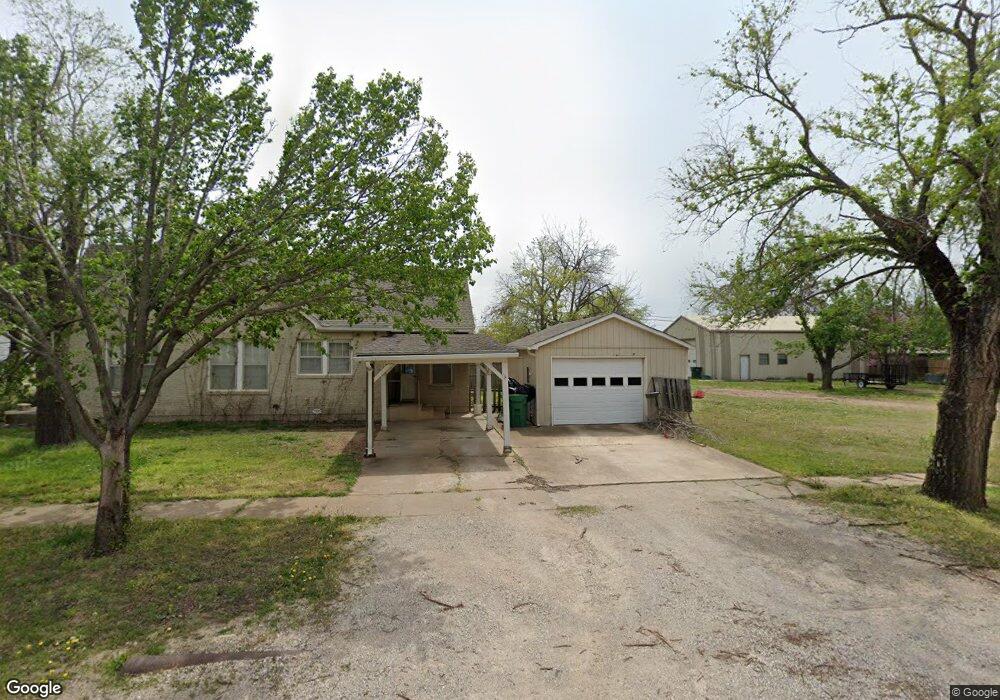
309 W Cherokee St W Garber, OK 73738
Estimated Value: $50,293 - $128,000
--
Bed
--
Bath
--
Sq Ft
6
Acres
About This Home
This home is located at 309 W Cherokee St W, Garber, OK 73738 and is currently estimated at $89,764. 309 W Cherokee St W is a home with nearby schools including Garber Elementary School and Garber High School.
Ownership History
Date
Name
Owned For
Owner Type
Purchase Details
Closed on
Apr 23, 2021
Sold by
Hatfield David and Hatfield Tifiny
Bought by
Rodriguez Sherry and Rodriguez Octavio
Current Estimated Value
Home Financials for this Owner
Home Financials are based on the most recent Mortgage that was taken out on this home.
Original Mortgage
$42,100
Outstanding Balance
$38,072
Interest Rate
3.1%
Mortgage Type
Purchase Money Mortgage
Estimated Equity
$51,692
Purchase Details
Closed on
Aug 17, 2018
Sold by
Powell Austin R and Powell Maggie K
Bought by
Appleton Mark White and Hatfield David
Purchase Details
Closed on
Feb 17, 2015
Sold by
Southwick Paul D and Southwick Michelle
Bought by
Powell Austin R and Powell Maggie K
Home Financials for this Owner
Home Financials are based on the most recent Mortgage that was taken out on this home.
Original Mortgage
$40,674
Interest Rate
3.92%
Mortgage Type
Unknown
Purchase Details
Closed on
Jan 19, 2005
Sold by
Southwick Shirley
Bought by
Southwick Paul
Purchase Details
Closed on
Dec 30, 1983
Sold by
Southwick Paul W
Bought by
Southwick Paul Dudley
Create a Home Valuation Report for This Property
The Home Valuation Report is an in-depth analysis detailing your home's value as well as a comparison with similar homes in the area
Home Values in the Area
Average Home Value in this Area
Purchase History
| Date | Buyer | Sale Price | Title Company |
|---|---|---|---|
| Rodriguez Sherry | $40,000 | Apex Title & Closing Svcs | |
| Appleton Mark White | $35,000 | None Available | |
| Powell Austin R | $40,000 | None Available | |
| Southwick Paul | -- | None Available | |
| Southwick Paul Dudley | -- | -- |
Source: Public Records
Mortgage History
| Date | Status | Borrower | Loan Amount |
|---|---|---|---|
| Open | Rodriguez Sherry | $42,100 | |
| Previous Owner | Powell Austin R | $40,674 |
Source: Public Records
Tax History Compared to Growth
Tax History
| Year | Tax Paid | Tax Assessment Tax Assessment Total Assessment is a certain percentage of the fair market value that is determined by local assessors to be the total taxable value of land and additions on the property. | Land | Improvement |
|---|---|---|---|---|
| 2024 | $196 | $1,900 | $910 | $990 |
| 2023 | $370 | $3,586 | $910 | $2,676 |
| 2022 | $384 | $3,586 | $910 | $2,676 |
| 2021 | $414 | $3,890 | $1,125 | $2,765 |
| 2020 | $418 | $3,977 | $1,125 | $2,852 |
| 2019 | $447 | $4,500 | $1,125 | $3,375 |
| 2018 | $175 | $1,785 | $561 | $1,224 |
| 2017 | $173 | $1,700 | $500 | $1,200 |
| 2016 | $158 | $1,700 | $500 | $1,200 |
| 2015 | $162 | $1,700 | $500 | $1,200 |
| 2014 | $150 | $1,575 | $375 | $1,200 |
Source: Public Records
Map
Nearby Homes
- 508 W Ponca St
- 321 Comanche St
- 118 W Ponca
- 519 W Ponca St
- 722 Main St
- 321 E Ponca St
- 219 Versailles
- 225 S 150th St
- 19816 E Wheat Capital Rd
- 3818 Harlo
- 3422 S 126th St
- 404 E Denver St
- 4118 S 126th St
- 4120 S 126th St
- 0 Bredhoft St
- 208 E Quincy
- Garfield County Area
- 520 Howard St
- 13504 E0470 Rd
- 112 6th St
- 504 Comanche St Unit On Hwy 74
- 504 Comanche St
- 318 E Ponca St
- 318 W Ponca St
- 310 W Ponca St
- 20126 Reim Dr
- 501 Cheyenne St Unit 309 W Cherokee
- 501 Cheyenne St
- 521 Cheyenne St
- 318 W Cherokee St
- 312 W Cherokee St
- 404 W Ponca St
- 302 W Cherokee St
- E350Rd State Highway 74
- 520 Cheyenne St
- 322 W Cherokee St
- 510 Cheyenne St
- 321 W Ponca St
- 313 W Ponca St
- 221 W Cherokee St