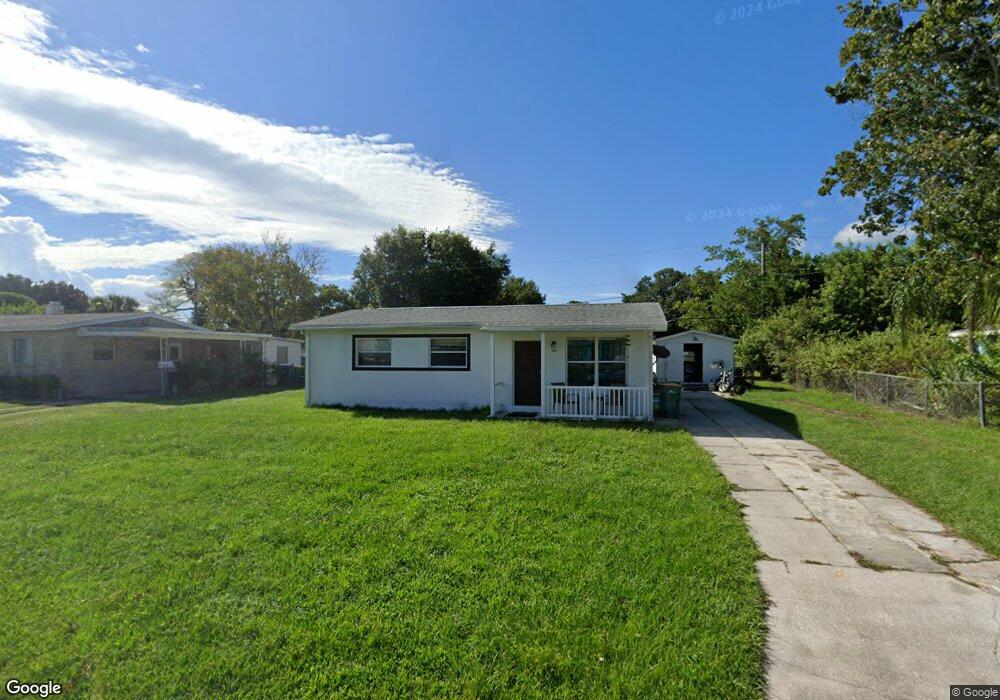
309 W Rutgers St Melbourne, FL 32901
Estimated Value: $190,000 - $229,000
3
Beds
2
Baths
912
Sq Ft
$235/Sq Ft
Est. Value
About This Home
This home is located at 309 W Rutgers St, Melbourne, FL 32901 and is currently estimated at $214,679, approximately $235 per square foot. 309 W Rutgers St is a home located in Brevard County with nearby schools including University Park Elementary School, Stone Magnet Middle School, and Melbourne Senior High School.
Ownership History
Date
Name
Owned For
Owner Type
Purchase Details
Closed on
Jul 30, 2018
Sold by
Daniel Barbara J and The John R Daniel And Barbara
Bought by
Sue Chance Llc
Current Estimated Value
Home Financials for this Owner
Home Financials are based on the most recent Mortgage that was taken out on this home.
Original Mortgage
$95,900
Outstanding Balance
$83,285
Interest Rate
4.5%
Estimated Equity
$131,394
Purchase Details
Closed on
May 9, 2014
Sold by
Daniel John R
Bought by
The John R & Barbara J Daniel Revocable
Purchase Details
Closed on
Apr 9, 1997
Sold by
Merritt Ruby and Merritt Chris
Bought by
Daniel John R
Home Financials for this Owner
Home Financials are based on the most recent Mortgage that was taken out on this home.
Original Mortgage
$27,000
Interest Rate
7.86%
Purchase Details
Closed on
Sep 27, 1993
Sold by
Merritt Royal L and Merritt Royall L
Bought by
Merritt Ruby and Merritt Reid
Create a Home Valuation Report for This Property
The Home Valuation Report is an in-depth analysis detailing your home's value as well as a comparison with similar homes in the area
Home Values in the Area
Average Home Value in this Area
Purchase History
| Date | Buyer | Sale Price | Title Company |
|---|---|---|---|
| Sue Chance Llc | $137,000 | Sunbelt Title Agency | |
| Daniel Barbara J | -- | Sunbelt Title Agency | |
| The John R & Barbara J Daniel Revocable | -- | None Available | |
| Daniel John R | $32,000 | -- | |
| Merritt Ruby | -- | -- |
Source: Public Records
Mortgage History
| Date | Status | Borrower | Loan Amount |
|---|---|---|---|
| Open | Sue Chance Llc | $95,900 | |
| Previous Owner | Daniel John R | $27,000 |
Source: Public Records
Tax History Compared to Growth
Tax History
| Year | Tax Paid | Tax Assessment Tax Assessment Total Assessment is a certain percentage of the fair market value that is determined by local assessors to be the total taxable value of land and additions on the property. | Land | Improvement |
|---|---|---|---|---|
| 2025 | $2,842 | $161,750 | -- | -- |
| 2024 | $2,647 | $171,270 | -- | -- |
| 2023 | $2,647 | $159,510 | $0 | $0 |
| 2022 | $2,309 | $137,560 | $0 | $0 |
| 2021 | $2,051 | $115,050 | $55,000 | $60,050 |
| 2020 | $1,967 | $103,000 | $45,000 | $58,000 |
| 2019 | $2,041 | $103,060 | $45,000 | $58,060 |
| 2018 | $1,508 | $84,300 | $40,000 | $44,300 |
| 2017 | $1,382 | $71,280 | $35,000 | $36,280 |
| 2016 | $1,271 | $56,050 | $20,000 | $36,050 |
| 2015 | $1,125 | $52,400 | $20,000 | $32,400 |
| 2014 | $879 | $39,560 | $15,000 | $24,560 |
Source: Public Records
Map
Nearby Homes
- 316 Cornell Ave
- 300 Rutgers Ave
- 309 Cornell Ave
- 2917 Rollins St
- 3353 Jay Tee Dr
- 3314 Purdue St
- 424 Brown Ave
- 600 Auburn Ave
- 3463 Fan Palm Blvd
- 611 Tulane Ave
- 611 Cornell Ave
- 636 Fishtail Palm Blvd
- 617 Cornell Ave
- 3393 Florida Palm Ave
- 3465 Cabbage Palm Ave
- 3083 Forest Creek Dr
- 3033 Forest Creek Dr
- 3486 Cabbage Palm Ave
- 2615 Putters Ln
- 3542 D'Avinci Way Unit 2026
- 309 Rutgers Ave
- 311 Rutgers Ave
- 308 Rutgers Ave
- 307 Rutgers Ave
- 310 Rutgers Ave
- 306 Rutgers Ave
- 315 Rutgers Ave
- 315 W Rutgers St
- 310 Cornell Ave
- 312 Cornell Ave
- 314 Rutgers Ave
- 308 Cornell Ave
- 305 Rutgers Ave
- 304 Rutgers Ave
- 309 Princeton Ave
- 314 W Rutgers St
- 317 Rutgers Ave
- 317 W Rutgers St
- 311 Princeton Ave
- 316 Rutgers Ave