309 W Tyler St Dalton, GA 30720
Estimated Value: $207,000 - $242,000
4
Beds
2
Baths
1,456
Sq Ft
$157/Sq Ft
Est. Value
About This Home
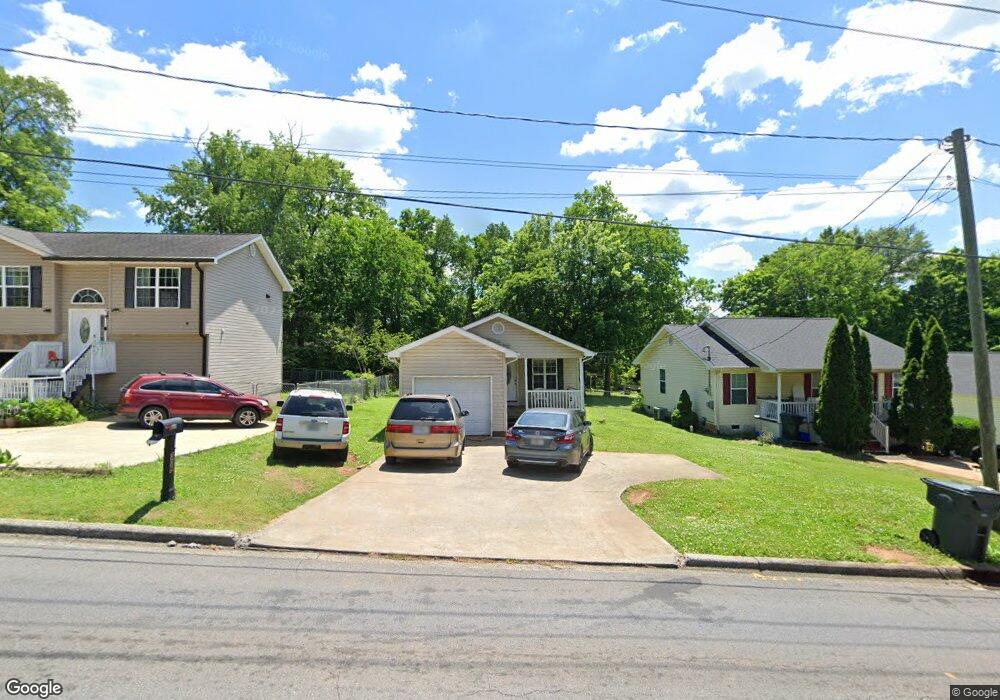
This home is located at 309 W Tyler St, Dalton, GA 30720 and is currently estimated at $227,933, approximately $156 per square foot. 309 W Tyler St is a home located in Whitfield County with nearby schools including City Park Elementary School, Dalton Middle School, and Dalton High School.
Ownership History
Date
Name
Owned For
Owner Type
Purchase Details
Closed on
Sep 17, 2020
Sold by
Gowan Properties Inc
Bought by
Sosa Amalia De Jesus
Current Estimated Value
Purchase Details
Closed on
Apr 2, 2009
Sold by
Secretary Of Housing
Bought by
Gowan Properties Inc
Purchase Details
Closed on
Aug 5, 2008
Sold by
Not Provided
Bought by
Gowan Properties Inc
Purchase Details
Closed on
Feb 2, 2005
Sold by
Not Provided
Bought by
Gowan Properties Inc
Purchase Details
Closed on
Feb 1, 2005
Sold by
Not Provided
Bought by
Gowan Properties Inc
Create a Home Valuation Report for This Property
The Home Valuation Report is an in-depth analysis detailing your home's value as well as a comparison with similar homes in the area
Home Values in the Area
Average Home Value in this Area
Purchase History
| Date | Buyer | Sale Price | Title Company |
|---|---|---|---|
| Sosa Amalia De Jesus | -- | None Listed On Document | |
| Gowan Properties Inc | $58,766 | -- | |
| Gowan Properties Inc | $116,343 | -- | |
| Countrywide Home Loans Inc | -- | -- | |
| Gowan Properties Inc | $119,400 | -- | |
| Gowan Properties Inc | -- | -- |
Source: Public Records
Tax History Compared to Growth
Tax History
| Year | Tax Paid | Tax Assessment Tax Assessment Total Assessment is a certain percentage of the fair market value that is determined by local assessors to be the total taxable value of land and additions on the property. | Land | Improvement |
|---|---|---|---|---|
| 2024 | $2,082 | $73,023 | $8,400 | $64,623 |
| 2023 | $2,082 | $56,340 | $5,400 | $50,940 |
| 2022 | $1,521 | $44,149 | $5,400 | $38,749 |
| 2021 | $1,523 | $44,149 | $5,400 | $38,749 |
| 2020 | $1,582 | $44,149 | $5,400 | $38,749 |
| 2019 | $1,561 | $42,244 | $5,400 | $36,844 |
| 2018 | $1,584 | $42,244 | $5,400 | $36,844 |
| 2017 | $1,525 | $42,244 | $5,400 | $36,844 |
| 2016 | $1,435 | $39,510 | $6,000 | $33,510 |
| 2014 | $1,287 | $39,011 | $9,240 | $29,771 |
| 2013 | -- | $39,010 | $9,240 | $29,770 |
Source: Public Records
Map
Nearby Homes