Estimated Value: $166,000 - $216,000
About This Home
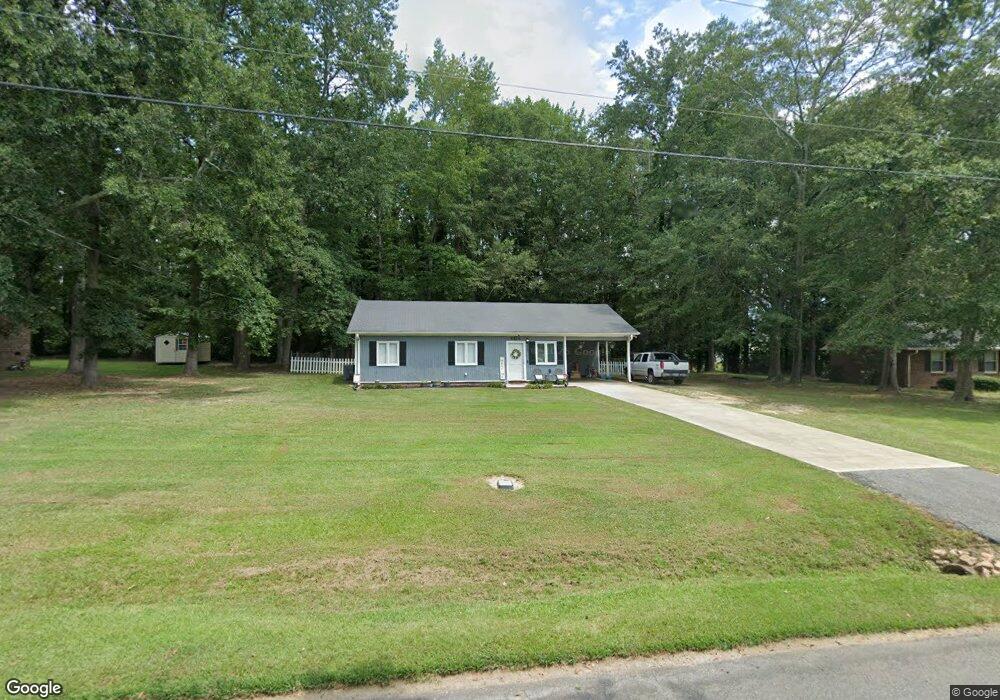
This home is located at 309 Wesley Ct, Starr, SC 29684 and is currently estimated at $197,144, approximately $189 per square foot. 309 Wesley Ct is a home located in Anderson County with nearby schools including Crescent High School.
Ownership History
We collect this data history from publicly available records. To have your information removed, we recommend requesting removal directly through your county’s website.
Purchase Details
Home Financials for this Owner
Home Financials are based on the most recent Mortgage that was taken out on this home.Purchase Details
Home Financials for this Owner
Home Financials are based on the most recent Mortgage that was taken out on this home.Purchase Details
Purchase Details
Home Values in the Area
Average Home Value in this Area
Purchase History
We collect this data history from publicly available records. To have your information removed, we recommend requesting removal directly through your county’s website.
| Date | Buyer | Sale Price | Title Company |
|---|---|---|---|
| $85,000 | -- | ||
| $79,900 | None Available | ||
| $50,000 | -- | ||
| $62,000 | -- |
Mortgage History
We collect this data history from publicly available records. To have your information removed, we recommend requesting removal directly through your county’s website.
| Date | Status | Borrower | Loan Amount |
|---|---|---|---|
| Open | $88,082 | ||
| Previous Owner | $79,900 |
Tax History
We collect this data history from publicly available records. To have your information removed, we recommend requesting removal directly through your county’s website.
| Year | Tax Paid | Tax Assessment Tax Assessment Total Assessment is a certain percentage of the fair market value that is determined by local assessors to be the total taxable value of land and additions on the property. | Land | Improvement |
|---|---|---|---|---|
| 2025 | $646 | $4,440 | $550 | $3,890 |
| 2024 | $646 | $4,440 | $550 | $3,890 |
| 2023 | $638 | $4,440 | $550 | $3,890 |
| 2022 | $612 | $4,440 | $550 | $3,890 |
| 2021 | $552 | $3,420 | $300 | $3,120 |
| 2020 | $546 | $3,420 | $300 | $3,120 |
| 2019 | $546 | $3,420 | $300 | $3,120 |
| 2018 | $547 | $3,420 | $300 | $3,120 |
| 2017 | -- | $3,420 | $300 | $3,120 |
| 2016 | $542 | $3,380 | $300 | $3,080 |
| 2015 | $553 | $3,380 | $300 | $3,080 |
| 2014 | $559 | $3,380 | $300 | $3,080 |
Map
- 113 Sunrise Dr Unit SUN0007
- 293 Harry Dr
- 4501 Keys St
- 115 Combine Ln
- 107 Chantilly Cir
- 107 Combine Ln
- 800 True Temper Rd
- 238 Forest Ln
- 109 Carson Dr
- 102 Westway Ct
- 209 Poplar Ln
- 800 Travis Rd
- 216 Riley St
- 1511 Flat Rock Rd
- 1515 Flat Rock Rd
- 0 Airline Rd Unit Lot 2
- 2047 Flat Rock Rd
- 2047 Flat Rock Rd
- 106 Unity Church Rd
- 2821 Middleton Rd
- 313 Wesley Ct
- 307 Wesley Ct
- 311 Wesley Ct
- 804 Flat Rock Rd
- 306 Wesley Ct
- 903 Flatrock Rd
- 314 Wesley Ct
- 319 Wesley Ct
- 903 Flat Rock Rd
- 208 Wesley Ct
- 322 Wesley Ct
- 52 Jones Rd
- 325 Wesley Ct
- 206 Wesley Ct
- 915 Flat Rock Rd Unit 4
- 915 Flat Rock Rd
- 300 Wesley Ct
- 400 Wesley Ct
- 310 Wesley Ct
- 919 Flat Rock Rd Unit 3
Ask me questions while you tour the home.