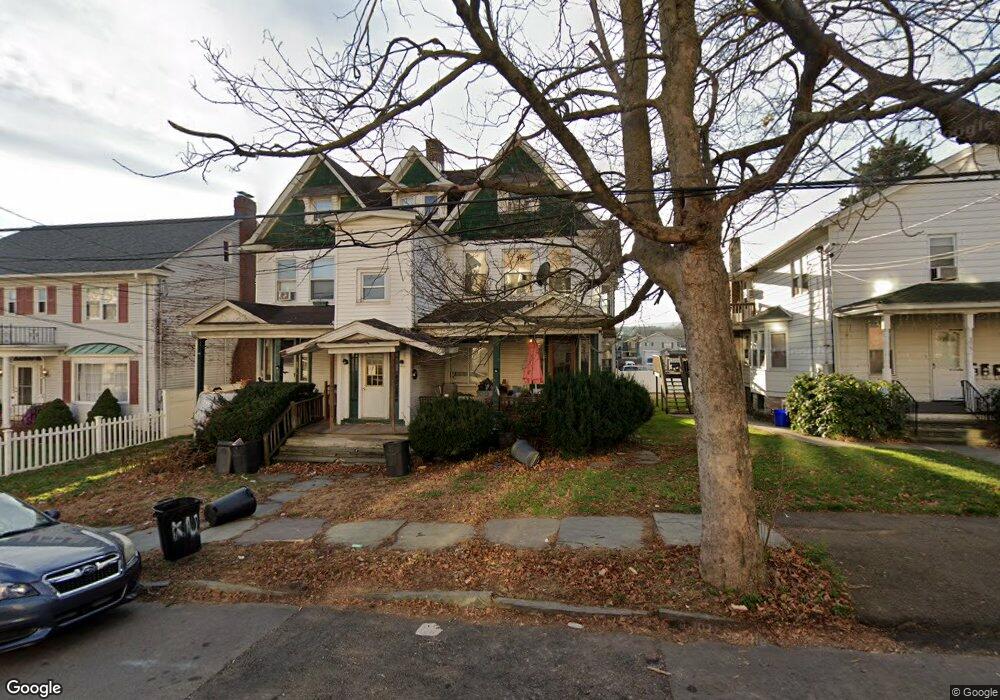
309 William St Unit 311 Scranton, PA 18508
Providence NeighborhoodEstimated Value: $156,000 - $308,000
--
Bed
--
Bath
--
Sq Ft
6,708
Sq Ft Lot
About This Home
This home is located at 309 William St Unit 311, Scranton, PA 18508 and is currently estimated at $224,667. 309 William St Unit 311 is a home located in Lackawanna County with nearby schools including Neil Armstrong Elementary School, Scranton High School, and St. Paul St. Clare School St. Clare Campus.
Ownership History
Date
Name
Owned For
Owner Type
Purchase Details
Closed on
Oct 25, 2023
Sold by
Tls Investments Llc and Tls Investments
Bought by
C3p Llc
Current Estimated Value
Purchase Details
Closed on
Sep 3, 2020
Sold by
Mvls Investmcts Llc
Bought by
Tls Investments
Purchase Details
Closed on
Dec 17, 2018
Sold by
Kt Imperial Millenium Llc
Bought by
Mvls Investments Llc
Purchase Details
Closed on
May 23, 2006
Sold by
Weidow Edward
Bought by
Kt Imperial Millenium Llc
Create a Home Valuation Report for This Property
The Home Valuation Report is an in-depth analysis detailing your home's value as well as a comparison with similar homes in the area
Home Values in the Area
Average Home Value in this Area
Purchase History
| Date | Buyer | Sale Price | Title Company |
|---|---|---|---|
| C3p Llc | $195,000 | None Listed On Document | |
| Tls Investments | $130,000 | None Available | |
| Mvls Investments Llc | $140,000 | Keystone Abstract Svcs Inc S | |
| Kt Imperial Millenium Llc | $200,000 | None Available |
Source: Public Records
Mortgage History
| Date | Status | Borrower | Loan Amount |
|---|---|---|---|
| Closed | Kt Imperial Millenium Llc | $0 |
Source: Public Records
Tax History Compared to Growth
Tax History
| Year | Tax Paid | Tax Assessment Tax Assessment Total Assessment is a certain percentage of the fair market value that is determined by local assessors to be the total taxable value of land and additions on the property. | Land | Improvement |
|---|---|---|---|---|
| 2025 | $4,878 | $15,000 | $2,650 | $12,350 |
| 2024 | $4,461 | $15,000 | $2,650 | $12,350 |
| 2023 | $4,461 | $15,000 | $2,650 | $12,350 |
| 2022 | $4,363 | $15,000 | $2,650 | $12,350 |
| 2021 | $4,363 | $15,000 | $2,650 | $12,350 |
| 2020 | $4,282 | $15,000 | $2,650 | $12,350 |
| 2019 | $4,029 | $15,000 | $2,650 | $12,350 |
| 2018 | $4,029 | $15,000 | $2,650 | $12,350 |
| 2017 | $3,959 | $15,000 | $2,650 | $12,350 |
| 2016 | $0 | $15,000 | $2,650 | $12,350 |
| 2015 | $2,980 | $15,000 | $2,650 | $12,350 |
| 2014 | -- | $15,000 | $2,650 | $12,350 |
Source: Public Records
Map
Nearby Homes
- 314 W Market St
- 1718 Rear Wayne Ave
- 335 337 Spring
- 332 Spring St
- 2040 Margaret Ave Unit 2042
- 2040 Edna Ave
- 2113 Golden Ave
- 2105 Belmont Terrace
- 1729 Wayne Ave
- 1711 N Sumner Ave
- 440 Leggett St
- 119 Spring St
- 2089 N Main Ave
- 231 Putnam St
- 2219 Golden Ave
- 117 Ferdinand St
- 2124 Ballau Ave
- 1816 Bloom Ave
- 401 Putnam St
- 1515-1517 Brick Ave
- 309 William St
- 311 William St
- 309-311 William St
- 307 William St
- 315 William St
- 313 William St
- 313-315 William St
- 301 William St
- 309 School St
- 310 School St
- 316 School St
- 305 School St Unit 307
- 317 William St
- 307 School St
- 1921 Wayne Ave
- 300 William St Unit 2nd Floor
- 300 William St
- 300-302-302 William St Unit 302 2nd floor
- 300-302 William St
- 304 William St